SPY 4-day bullish forecast — Nov 13, 2026
- Bias: Bullish
- Timeframe: 4 days (made Nov 13, 2026, target date Nov 16, 2026)
- Price at analysis: $754.27
- Price target: $758.00
- Expected range: $741.00 – $767.00
- Result: Incorrect (-1.8%) — closed at $740.54 on Nov 16, 2026; quality score 47/100
Get a free AI analysis of SPY today
Analysis
TECHNICAL INDICATORS
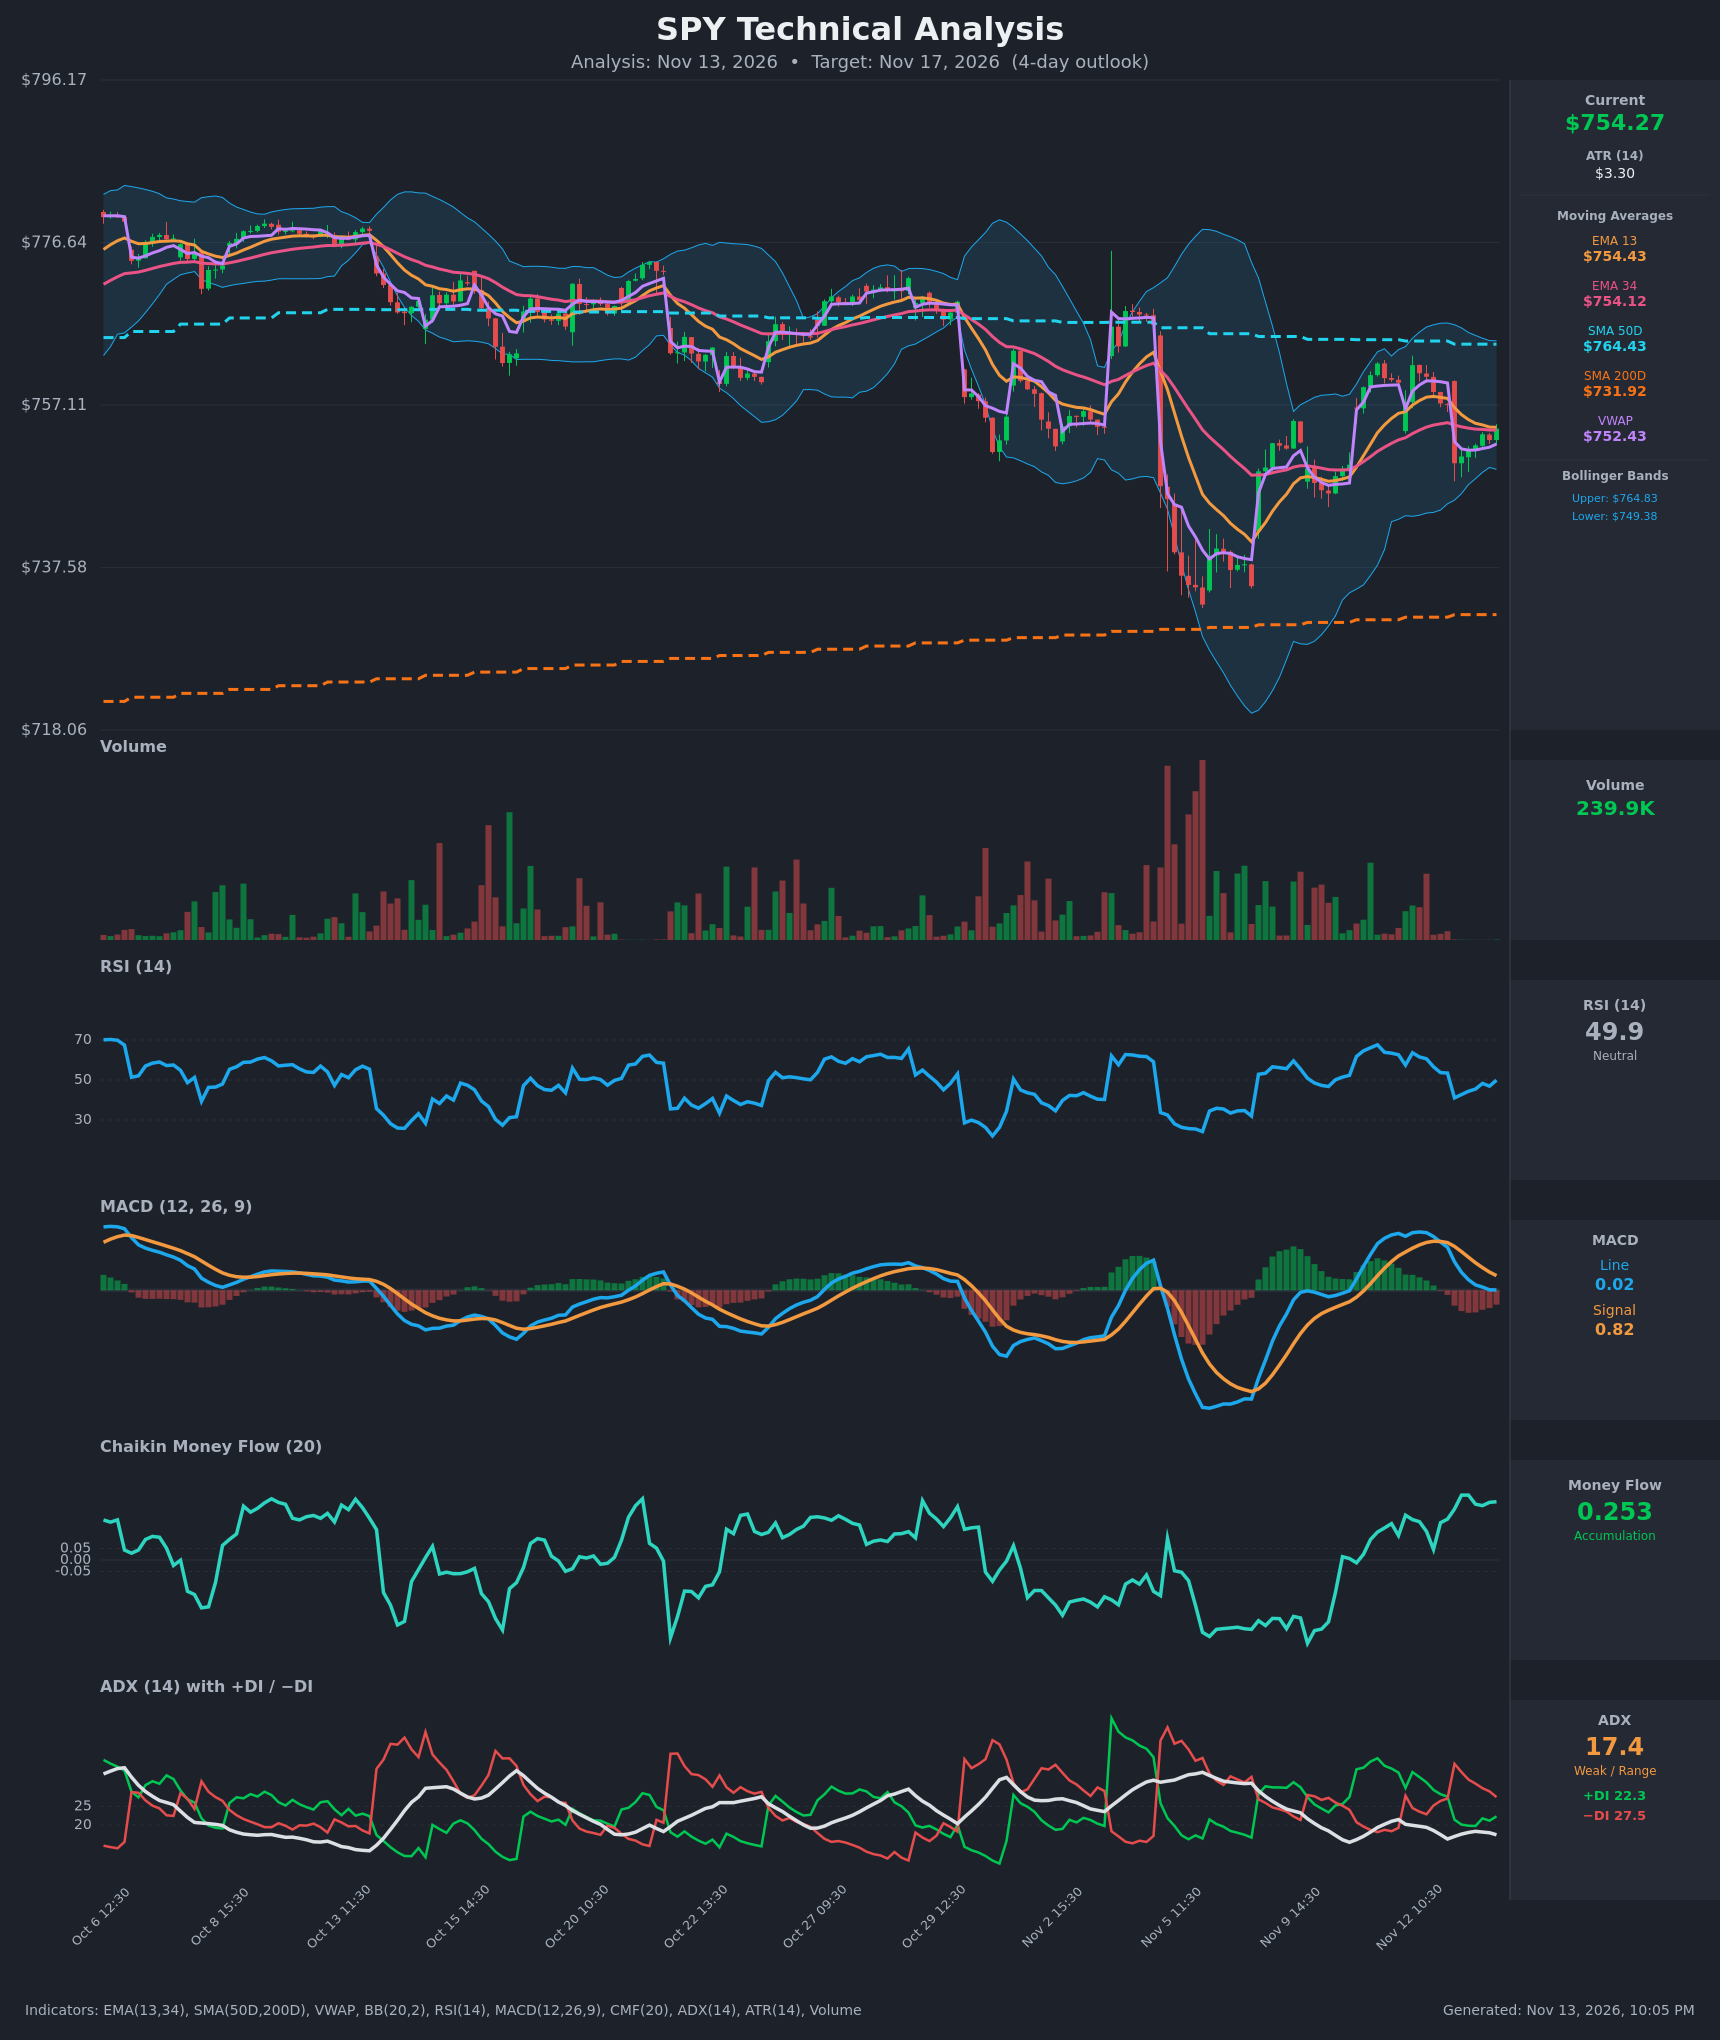
- RSI (14): 49.92, dead center after sliding from 63.6 (Nov 12 10:30) to a 41.1 low (Nov 13 open). It has since recovered about 9 points and is curling higher, but momentum is only neutral. [Neutral]
- 20 EMA: Only the EMA 13 ($754.43) and EMA 34 ($754.12) were supplied, so I use them as the short-term proxy. Price at $754.27 sits between the two, which are almost fully converged. EMA13 has rolled over from $758 but is flattening and still sits above EMA34, so there is no bearish crossover yet. Price is pinned to the average, so it offers neither support nor resistance. [Neutral]
- MACD: The line (0.02) is below the signal (0.82), so the cross is bearish. The histogram is about -0.80, but it has narrowed from its -1.25 trough. The line has rolled down to the zero axis and is flattening, so bearish momentum is fading but not yet reversed. [Bearish]
- Bollinger Bands (20): Price is $754.27 against bands of $749.38 to $764.83 and a midline near $757.1. Price sits in the lower half, and the Nov 13 low (about $750) held just above the lower band. Bandwidth is moderate and contracting from the early-November expansion. A bounce toward the midline is plausible, but price is below the mean. [Neutral]
- CMF (20): 0.253, well above +0.05, and near the top of its recent range. It has risen steadily from about 0.05 to 0.25 even as price pulled back, so buyers are absorbing the dip. [Accumulation]
- ADX (14): 17.4 and drifting lower, which means weak or range-bound. −DI (27.5) is above +DI (22.3), but the gap is narrowing (it was 36.4 vs 21.4 at the Nov 13 open). Bears hold only a slight edge in a trendless tape. [Weak Trend, slight bearish tilt]
- Volume: 239.9K on the latest bar, light compared with the heavy selling of Nov 5-6. The recent bounce came on modest volume, so there is no strong conviction either way. [Neutral]
- VWAP / SMAs (context): Price is above VWAP ($752.43) and well above SMA200D ($731.92), so the long-term uptrend is intact. It is below SMA50D ($764.43), which caps the rally. [Mildly Bullish]
DIVERGENCES & TRENDS
- CMF vs price: CMF is making higher highs (0.25) while price is flat to lower after the Nov 12 rejection near $762. This is a mild bullish divergence, which suggests accumulation under the surface.
- MACD: The histogram is improving (-1.25 to -0.80) while the line sits near zero, so downside momentum is decaying.
- RSI: It went from 41 to about 50 with higher intraday lows ($750.11, then $750.93, then $751.73, then $754.27). That is a modest short-term uptrend inside the pullback.
- DI lines: −DI is still on top but fading, and ADX at 17 confirms there is no trend. No DI crossover has occurred yet.
- Crossovers: The MACD bearish cross is in force. The EMA13/EMA34 spread is nearly zero, so a cross either way is imminent. There is no golden or death cross; SMA50D is well above SMA200D.
CHART PATTERNS
- Range / consolidation after a V-shaped recovery: Price bottomed around $733 on Nov 5-6, rebounded to about $762, then pulled back to $750-$754. This resembles a Symmetrical Triangle / Bullish Pennant-style consolidation, with converging EMAs, contracting ADX and narrowing swings. The pattern is not fully formed.
- Possible small Bullish Double Bottom on the hourly chart near $750 (Nov 13 open and the following bars). It needs a break above about $757-$758 to confirm, and the measured move would be about $6-$8, toward $762.
- Resistance: The $762-$765 zone (Nov 12 high, BB upper, SMA50D) caps the pattern.
- Support: The $749-$750 zone (BB lower, Nov 13 low).
POTENTIAL SCENARIOS
- Scenario 1: Bullish Mean-Reversion Bounce — CMF accumulation, the improving MACD histogram and the hold above VWAP point to a drift back toward the Bollinger midline. Trigger: hourly close above $757.5 with RSI above 55. Target: $758 to $762. Invalidation: close below $750. (45% probability)
- Scenario 2: Neutral Range Chop — ADX at 17, converged EMAs and a flat RSI keep SPY between $750 and $759 through Nov 17. Trigger: failure to break either $750 or $759. Target: $752 to $757. Invalidation: decisive break outside that band. (32% probability)
- Scenario 3: Bearish Breakdown — −DI dominance and the MACD below signal lead to a loss of the Nov 13 low. Trigger: hourly close below $749.4 (lower band). Target: $742 to $745. Invalidation: reclaim of $757. (23% probability)
PRICE TARGETS
- Target Price: $758.00 (4-day horizon, Nov 17)
- Expected Range: $741.00 to $767.00. The width is $26, or about 3.4% of current price, in line with the 2-4% guidance for short timeframes and about 2x a 1-2 day band.
- Key Levels: Support at $749.38, Resistance at $761.90
OVERALL BIAS
OVERALL BIAS: BULLISH - CMF shows strong accumulation, the MACD histogram is recovering, and price holds above VWAP and the SMA200D with RSI turning up from 41. The edge is modest because ADX is weak and −DI still leads, but bullish mean-reversion toward the $757-$762 area has the most evidence behind it.
This is educational analysis and not financial advice.