SPY 4-day bullish forecast — Nov 14, 2026
- Bias: Bullish
- Timeframe: 4 days (made Nov 14, 2026, target date Nov 17, 2026)
- Price at analysis: $754.25
- Price target: $757.75
- Expected range: $740.00 – $768.00
- Result: Incorrect (-2.9%) — closed at $732.44 on Nov 17, 2026; quality score 30/100
Get a free AI analysis of SPY today
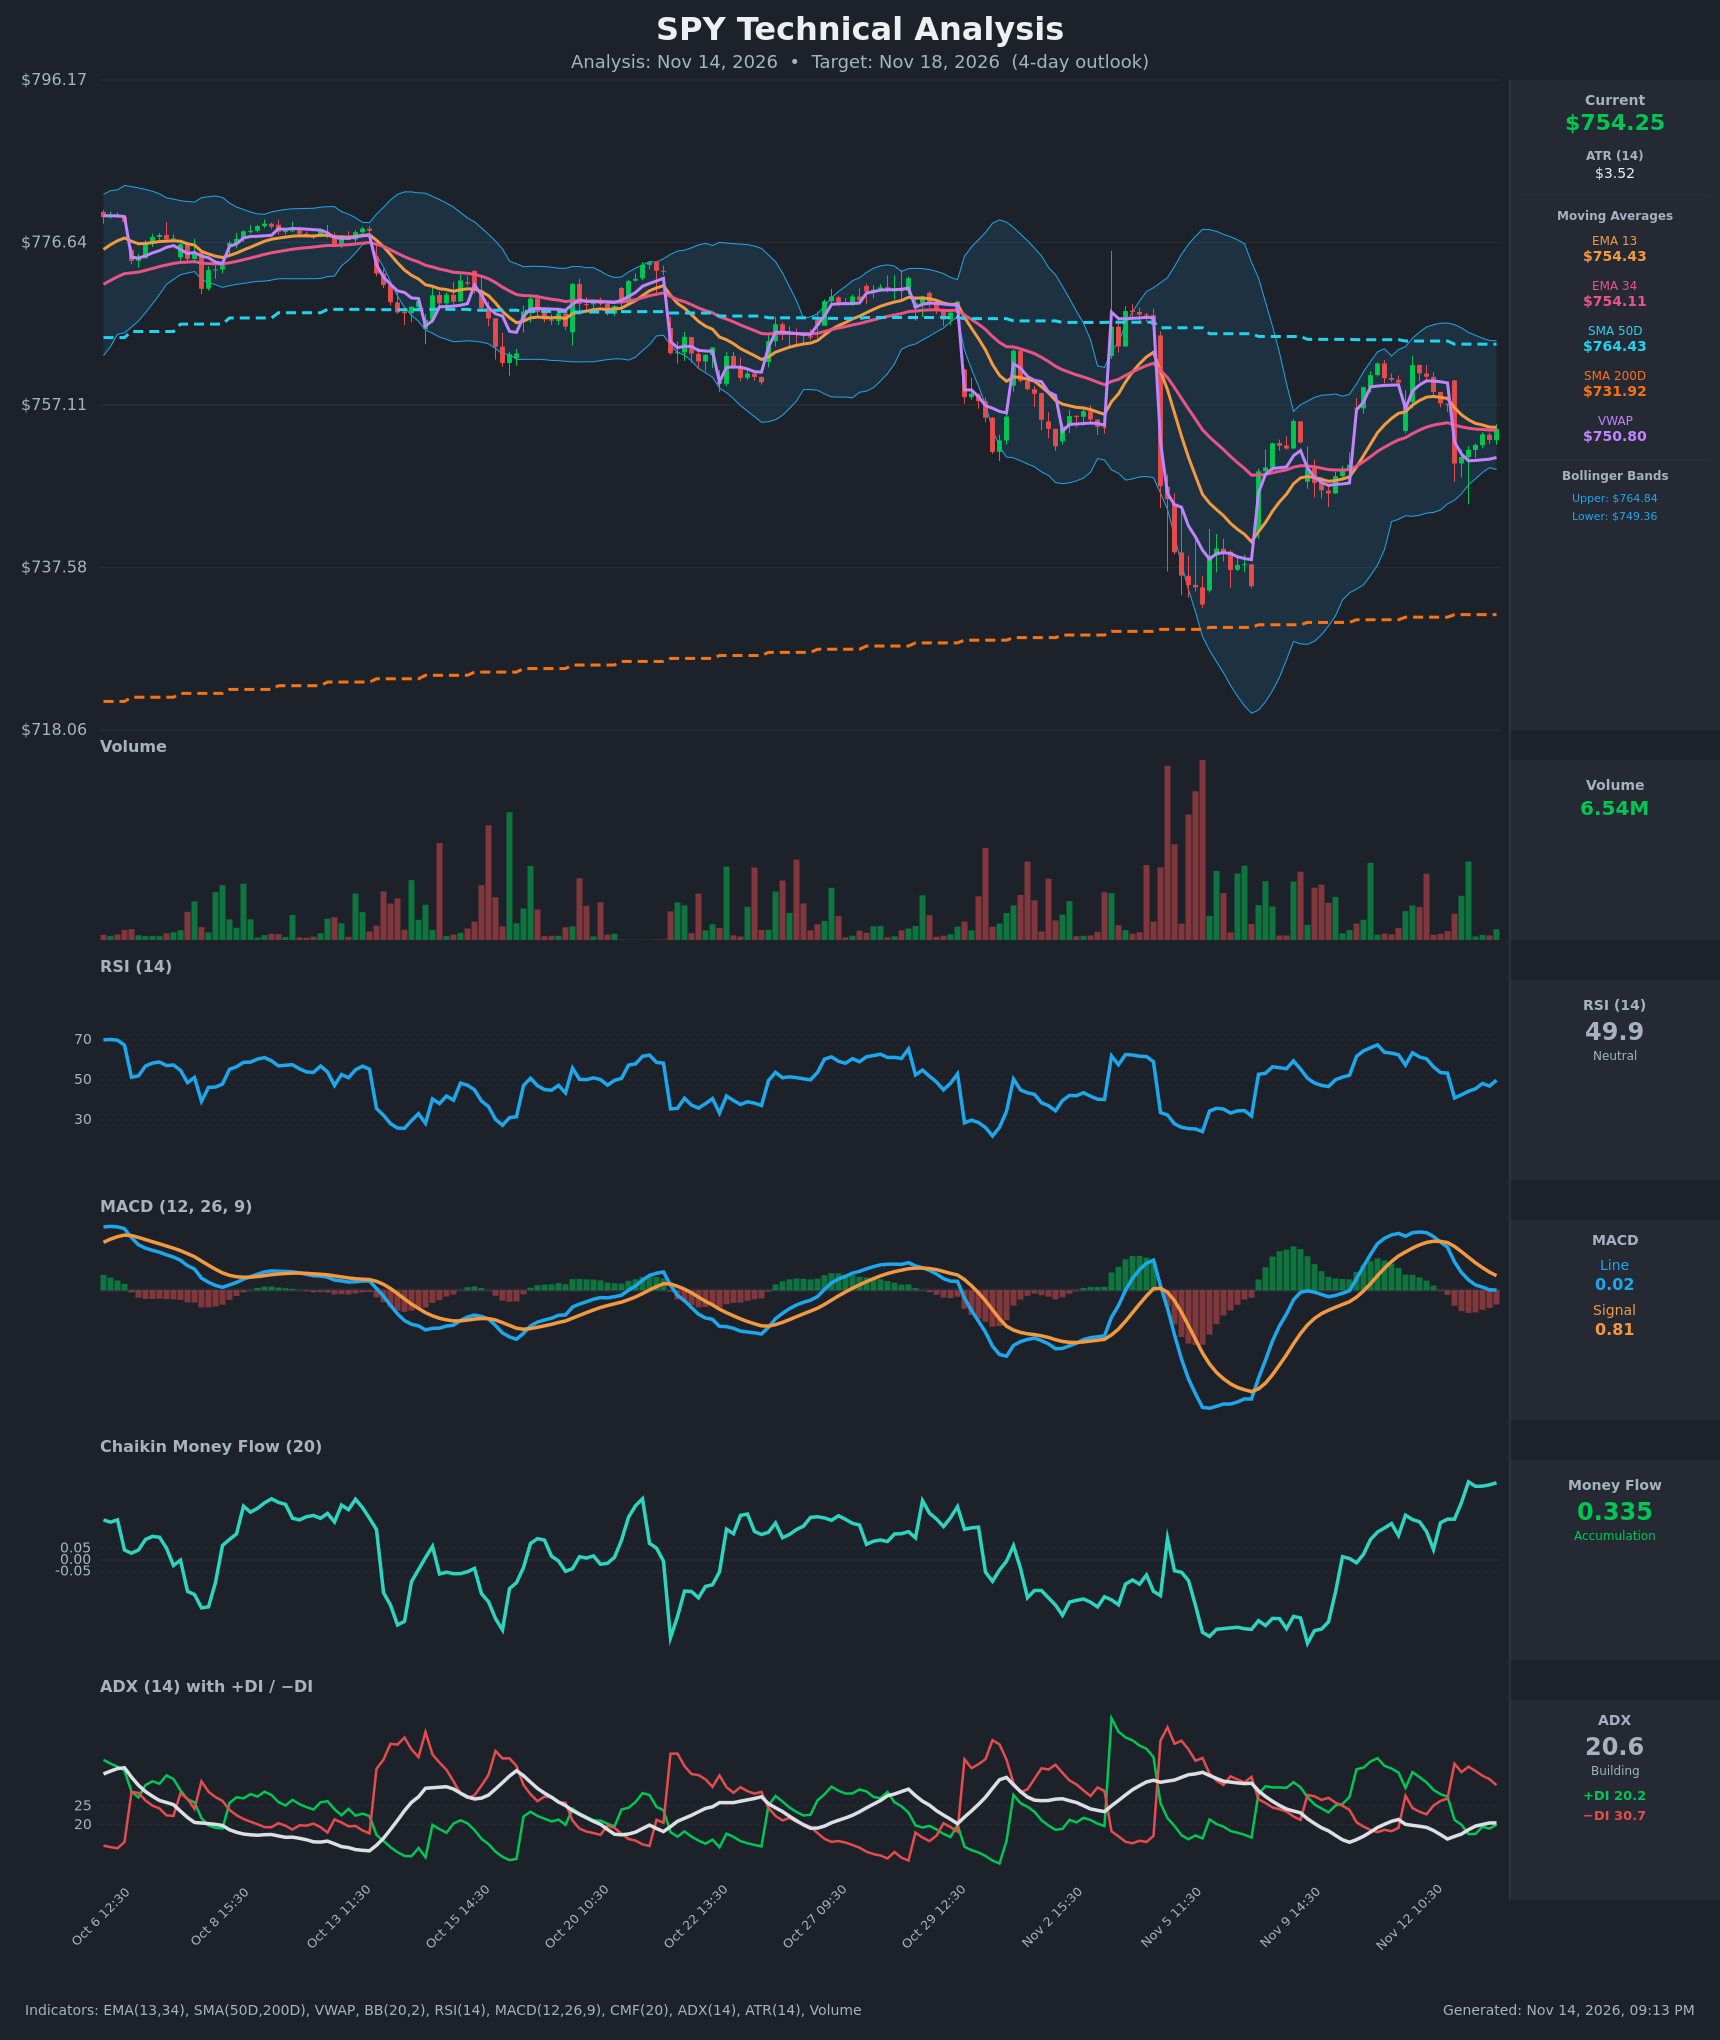
Analysis
TECHNICAL INDICATORS
- RSI (14): 49.89, dead neutral. It has recovered from 41.0 on Nov 13 morning and is rising again, so downside momentum has faded without a bullish thrust yet. [Neutral]
- 20 EMA (EMA 13/34 used): EMA13 is $754.43 and EMA34 is $754.11. Price at $754.25 sits between them, and the two averages are flat and almost converged. EMA13 is still barely above EMA34, so there is no bearish cross, but there is no trend either. [Neutral]
- MACD: The line is 0.016 and the signal is 0.813. The line crossed below the signal on Nov 12 afternoon and has fallen to roughly zero. The negative histogram is shrinking as the line flattens, which points to bearish momentum fading. The line is still below the signal, so no bullish cross has happened. [Bearish]
- Bollinger Bands (20): The upper band is $764.84 and the lower is $749.36, so the midline is about $757.10. Price is in the lower half of the bands, near the middle. The bands are moderately wide after the early-November volatility and are contracting. [Neutral]
- CMF (20): 0.335 is strong accumulation, the highest reading on the chart and sustained above +0.05 for several sessions. Buying pressure is underpinning price even during the pullback. [Accumulation]
- ADX (14): 20.6 and edging up from about 16, but still at the threshold of range-bound. −DI (30.7) is above +DI (20.2), so sellers lead, but the gap is narrowing from 36.4 vs 21.4. [Weak Trend, bearish lean]
- Volume: 6.54M on the latest bar, subdued compared with the spike days in early November. The latest green bars are light, so the bounce lacks conviction. Price is above VWAP ($750.80), which favors buyers intraday. [Neutral to slightly bullish]
Other context:
- Price is below the SMA50D ($764.43), which acts as overhead resistance.
- Price is well above the SMA200D ($731.92), so the long-term uptrend is intact.
- There is no golden or death cross.
DIVERGENCES & TRENDS
- CMF vs price: CMF has climbed to its chart high while price made a lower high and lower low from Nov 12 to Nov 13. This is a mild bullish divergence, suggesting accumulation under the pullback.
- MACD vs price: The histogram is rising toward zero while price stabilizes, so downside momentum is exhausting. A bullish MACD cross would need the line to push back above 0.8, which is not yet in sight.
- RSI: It has made a higher low from the Nov 13 open (41 to 49.9) as price bases around $750-754. This is a constructive recovery.
- DI: −DI is falling and +DI is recovering. The gap has narrowed from about 20 points to about 10, so bearish control is weakening but not reversed.
- Moving averages: EMA13 and EMA34 are flat and entwined, and price is sitting on both. This is a decision point, not a trend.
- Recent swing: Price rallied from the Nov 6 low near $733 to about $765. It then rolled over to roughly $750 and is bouncing.
CHART PATTERNS
- No clean reference pattern is complete. Price is in a consolidation range of roughly $749-$762 after the sharp V-shaped recovery from $733.
- Bullish Flag / bullish pennant (loosely): The decline after the Nov 12 high is shallow, on lighter volume, relative to the prior advance. A loose flag reading would favor a break back up. A move above $762 would project toward the SMA50/upper-band zone near $764-$765.
- Symmetrical triangle tendency: Highs are lower and lows are higher over the last several sessions, with narrowing ranges. This is a coiling structure that can break either way, but the larger prior up-leg and the positive CMF give a slight edge to an upside resolution.
- Bearish risk: A hourly close below $749.36 (lower BB) would break the base and open a retest of the $740s.
POTENTIAL SCENARIOS
- Scenario 1: Bullish Base Holds and Grind Higher — CMF accumulation, price above VWAP, and fading MACD downside lead to a recovery toward the Bollinger midline and the Nov 12 highs. Trigger: hourly close above $757.10 (BB midline) with RSI above 55. Target: $757.75-$762, with a stretch to the $764.4 SMA50. Invalidation: hourly close below $749.36. (45% probability)
- Scenario 2: Bearish Breakdown of the Base — −DI still leads and MACD is below its signal, so a loss of VWAP and the lower band could trigger another leg down. Trigger: close below $749.36 and VWAP at $750.80. Target: $743-$740. Invalidation: reclaim of $757. (30% probability)
- Scenario 3: Neutral Range Chop — Weak ADX (about 20) keeps price oscillating around the converged EMAs. Trigger: failure to break either $749 or $762. Target: $752-$758. Invalidation: close outside $749-$762. (25% probability)
PRICE TARGETS
- Target Price: $757.75 (4-day, Nov 18, 2026)
- Expected Range: $740.00 to $768.00 (width $28.00, about 3.7% of current price, scaled for a 4-day horizon)
- Key Levels: Support at $750.80 (VWAP; below it $749.36 lower Bollinger Band), Resistance at $761.90 (Nov 12 high; above it $764.43 SMA50)
OVERALL BIAS
OVERALL BIAS: BULLISH - Sustained strong CMF accumulation (0.335), price above VWAP and the long-term SMA200D, RSI recovering from 41, and a MACD histogram that is contracting favor a modest rebound toward the $757-$762 zone. The bias is modest because ADX is weak, −DI still leads, and the SMA50 sits overhead; a close below $749.36 would invalidate it.
This is educational analysis and not financial advice.