SPY 7-day bullish forecast — Nov 14, 2026
- Bias: Bullish
- Timeframe: 7 days (made Nov 14, 2026, target date Nov 20, 2026)
- Price at analysis: $754.25
- Price target: $759.00
- Expected range: $737.00 – $772.00
- Result: Pending — graded after the close on Nov 20, 2026
Get a free AI analysis of SPY today
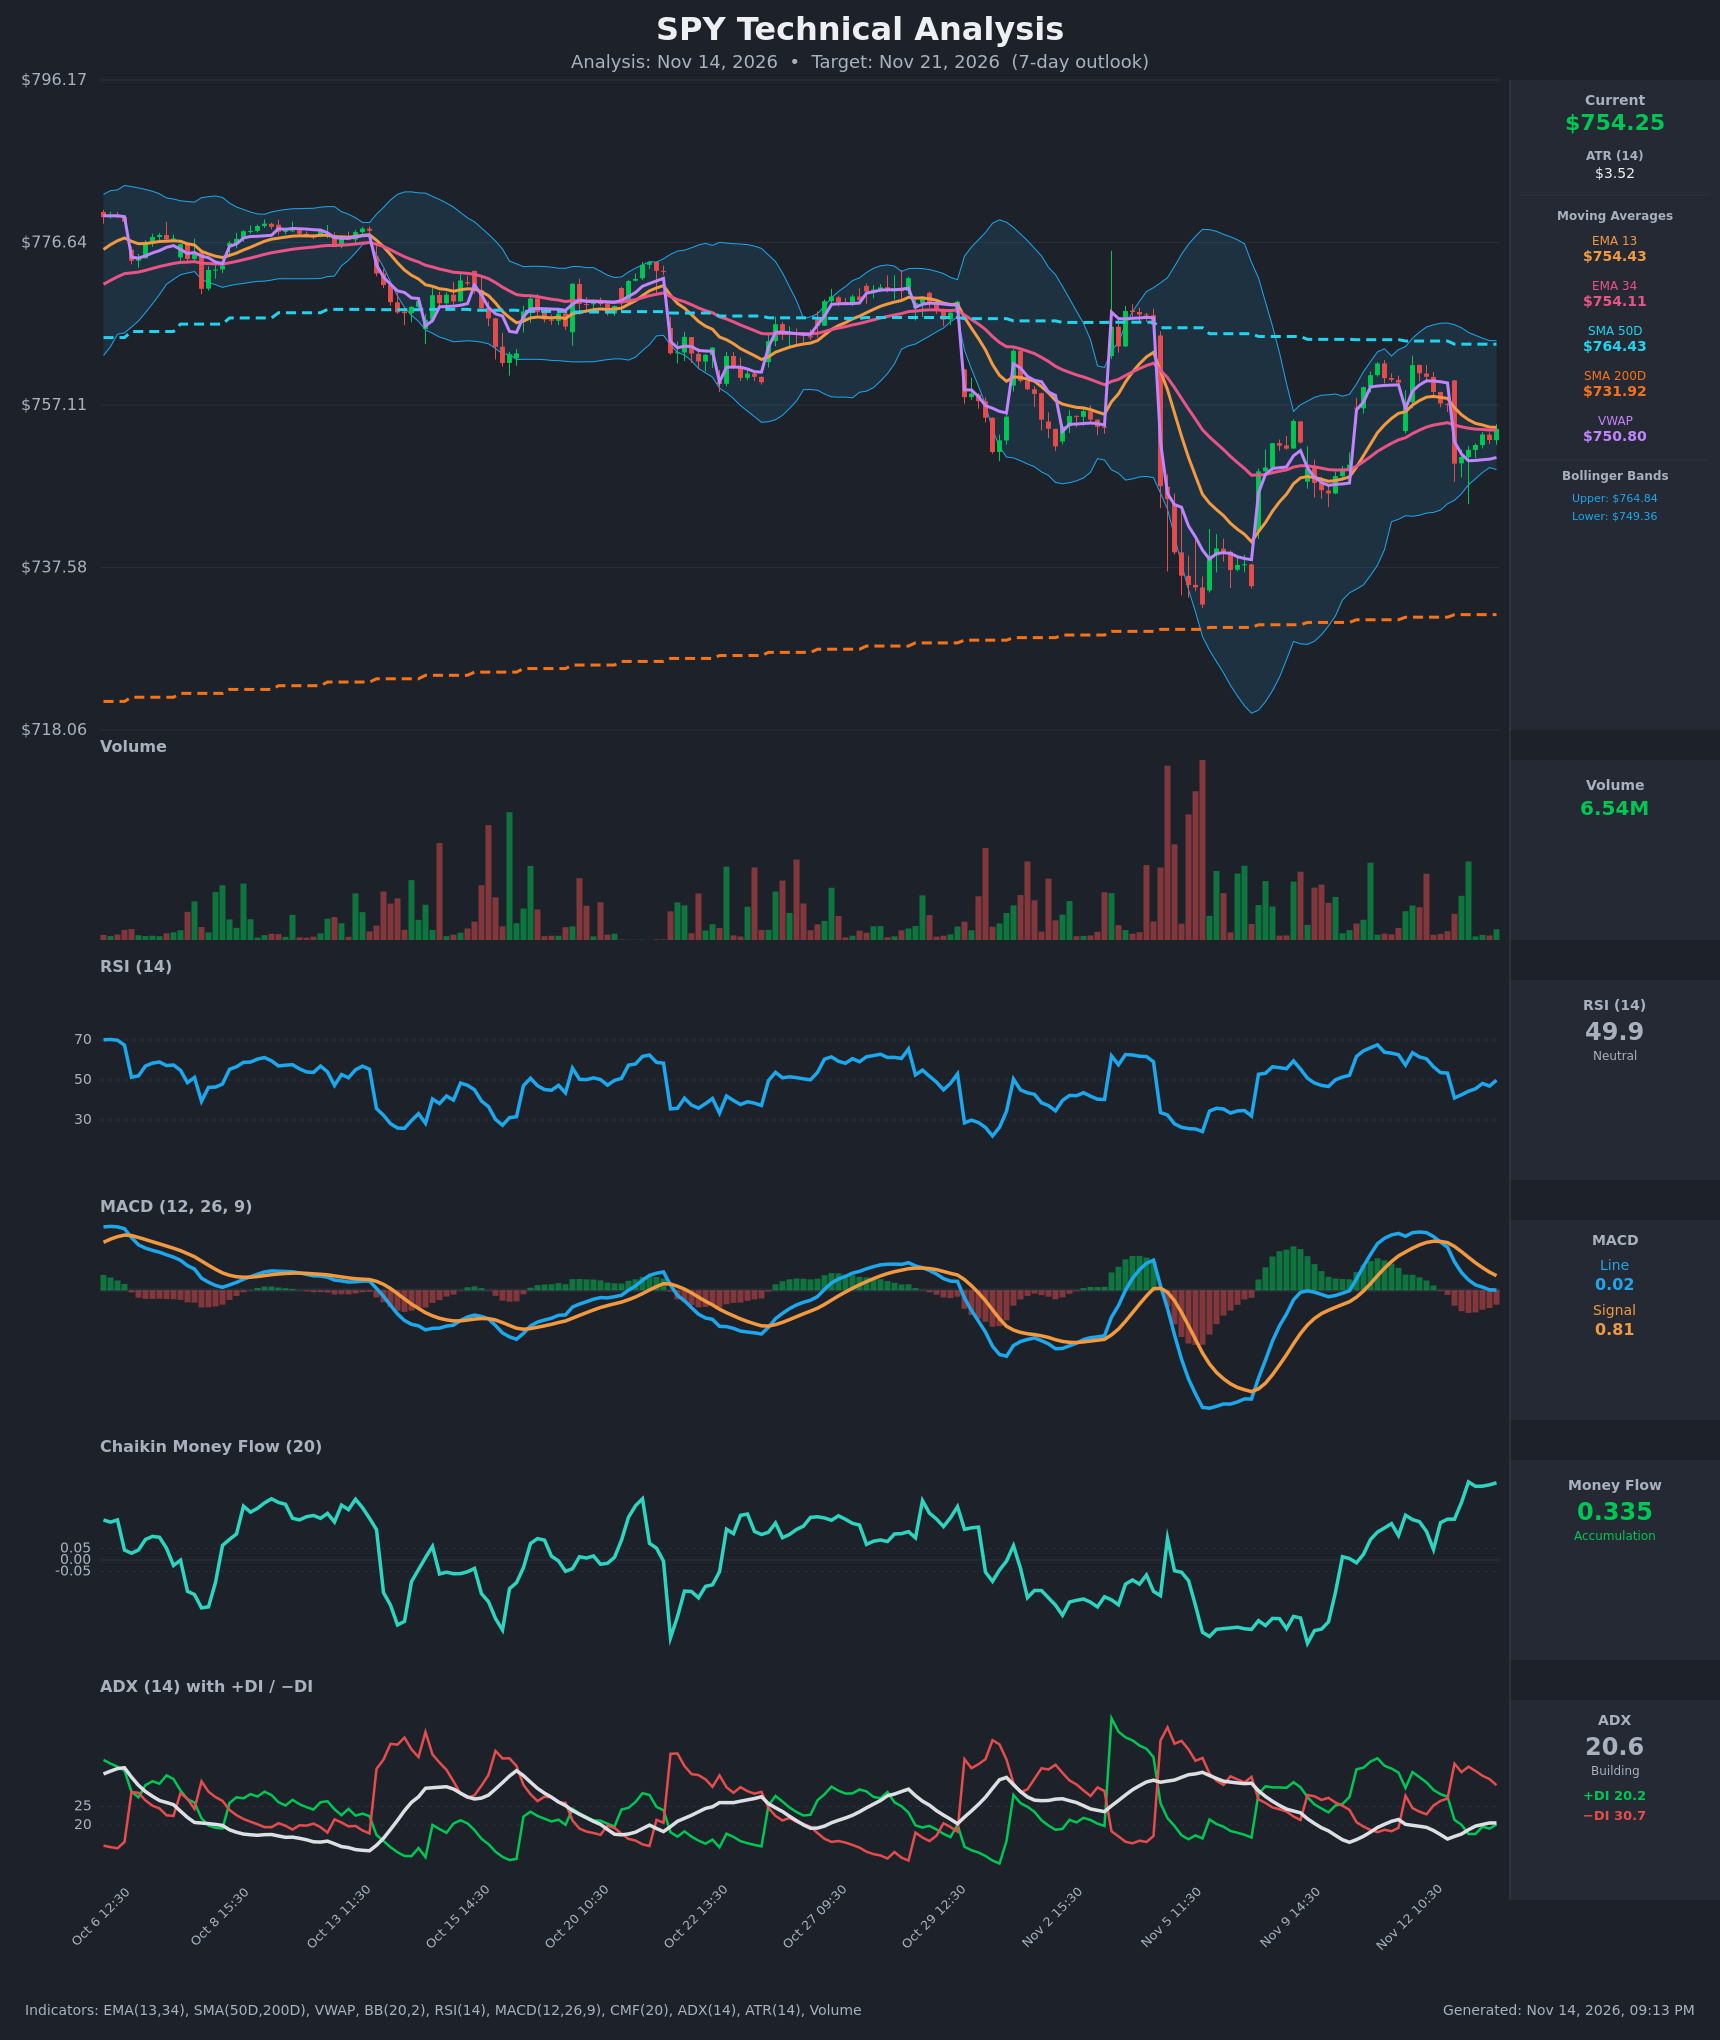
Analysis
TECHNICAL INDICATORS
- RSI (14): 49.89, dead neutral. It has recovered from 41.0 on the Nov 13 open and is making higher lows, so downside momentum has faded without turning bullish yet. [Neutral]
- 20 EMA: The data provides EMA 13 ($754.43) and EMA 34 ($754.11) rather than a 20 EMA. Price at $754.25 sits between them, and the two are converging. EMA13 is only just above EMA34 after being rolled over from $758. Price is pinned to the averages with no edge. [Neutral]
- MACD: Line is 0.016 and signal is 0.813, so the line is below the signal (bearish cross from Nov 12). The histogram is about -0.80, but it has narrowed from roughly -1.26 over the last several bars. The line has flattened at zero, which points to bearish momentum fading, though no bullish cross yet. [Neutral]
- Bollinger Bands (20): Upper $764.84, lower $749.36, midline about $757. Price is in the lower half, about 1.4 ATR from the lower band. The bands have contracted from the Nov 5 volatility spike, which suggests a squeeze. Price held the lower band on Nov 13, and a move back to the midline is the natural first target. [Neutral]
- CMF (20): 0.335, well above +0.05 and at its highest level of the entire chart. It has risen steadily for several sessions while price made lower lows. That is strong accumulation. [Accumulation]
- ADX (14): 20.6, barely rising off the lows, which is a weak, borderline trend. −DI (30.7) is above +DI (20.2), so sellers have the edge, but the spread is narrowing from the Nov 13 open (36.4 vs 21.4). [Weak Trend, bearish lean]
- Volume: 6.54M, light on the latest bars. The bounce from the Nov 13 gap-down came on subdued volume, so there is no capitulation or conviction either way. The big volume spikes on the chart were on the early-Nov selloff. [Neutral, low participation]
Other context:
- VWAP ($750.80): Price is above it, a mild buyer-control signal.
- SMA50D ($764.43): Overhead resistance, about 1.3% above price.
- SMA200D ($731.92): Far below, so the long-term uptrend is intact.
- SMA50D vs SMA200D: SMA50D is above SMA200D, so there is no death cross.
DIVERGENCES & TRENDS
- Bullish CMF divergence: CMF has climbed to its highest reading while price made lower highs and lows since the Nov 11 peak near $762. Money flow is not confirming the weakness.
- MACD: The bearish cross on Nov 12 is intact, but histogram contraction and the zero-line flattening suggest a momentum bottom.
- RSI: It fell from 63 to 41 and has since recovered to 50 with higher lows.
- DI lines: −DI still leads, with no bullish DI crossover yet. This is the main bearish counterweight.
- Structure: Price is below the SMA50D but above the SMA200D and VWAP. It is in a pullback within a larger range of roughly $745–$765.
CHART PATTERNS
- Possible Symmetrical Triangle / consolidation: Volatility is contracting after the Nov 5–6 low near $735, with a series of higher lows. This is not a clean pattern, and the 7-day outcome depends on a break of $749 or $757.
- Bullish Flag-like pullback: The decline from $762 to $750 on declining volume resembles a corrective flag within the recovery. If it resolves up, the measured move targets the SMA50D area ($764).
- Bearish risk: A Bearish Rising Wedge or Double Top is not clearly present. Price rolled over from $762 on a lower high versus the Nov 11 peak. A close below $749 would argue for a retest of the early-November lows.
POTENTIAL SCENARIOS
- Scenario 1: Bullish CMF-Led Rebound — Accumulation (CMF 0.335) plus a narrowing MACD histogram lets price reclaim the EMAs and BB midline. Trigger: hold above $751 and close above $757. Target: $759–$764 (SMA50D). Invalidation: close below $749. (45% probability)
- Scenario 2: Bearish Continuation Lower — −DI dominance and the MACD below signal lead to a break below the lower Bollinger Band and VWAP. Trigger: close below $749.36. Target: $740–$743. Invalidation: reclaim of $757. (30% probability)
- Scenario 3: Neutral Range Chop — Weak ADX and light volume keep price between $749 and $760 around the converged EMAs. Trigger: failure to break either side. Target: $752–$757. Invalidation: close outside $749–$760. (25% probability)
PRICE TARGETS
- Target Price: $759.00 (7-day)
- Expected Range: $737.00 to $772.00. Self-check: width $35, which is 4.6% of $754.25, within the 4–8% guide for 7–10 days.
- Key Levels: Support at $749.36, Resistance at $764.43
OVERALL BIAS
OVERALL BIAS: BULLISH - CMF at 0.335 is showing strong accumulation and diverging from the recent price weakness. Price is above VWAP, RSI is stabilizing at 50, and the MACD histogram is contracting. The weak ADX and dominant −DI keep conviction modest, with the SMA50D at $764 as the main hurdle.
This is educational analysis and not financial advice.