NVDA 6-day bullish forecast — Nov 15, 2026
- Bias: Bullish
- Timeframe: 6 days (made Nov 15, 2026, target date Nov 20, 2026)
- Price at analysis: $162.82
- Price target: $166.50
- Expected range: $157.50 – $170.00
- Result: Pending — graded after the close on Nov 20, 2026
Get a free AI analysis of NVDA today
Analysis
TECHNICAL INDICATORS
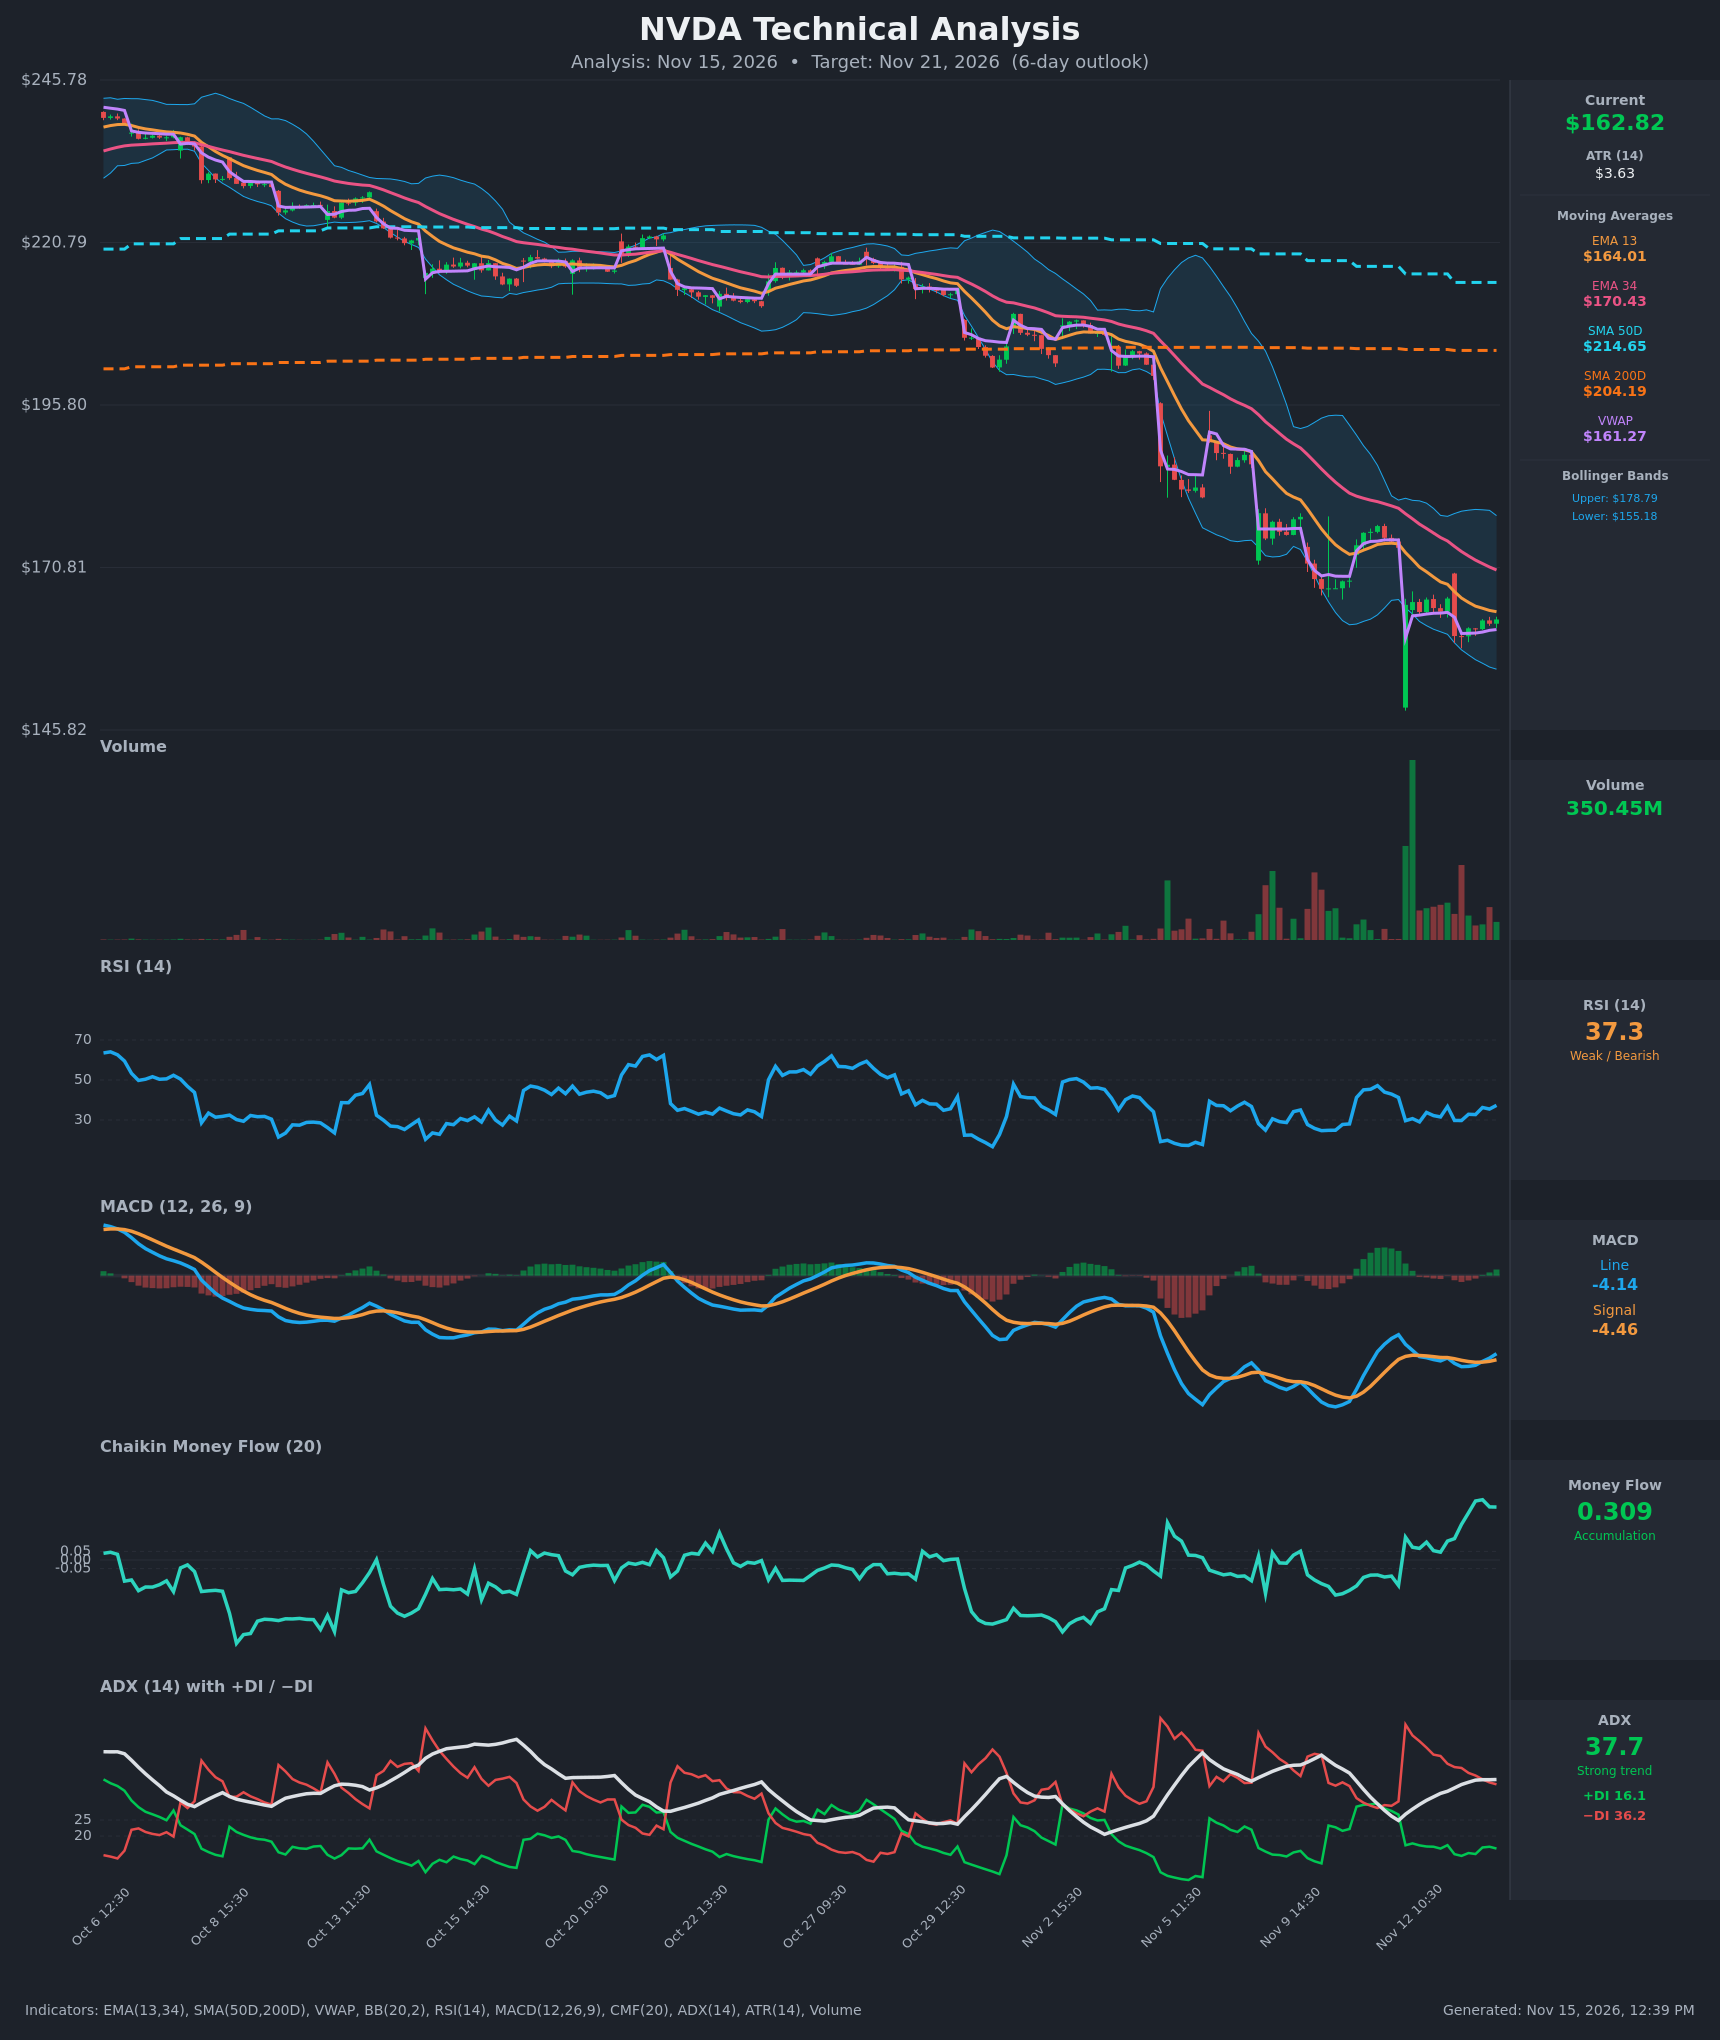
- RSI (14): 37.32, up from sub-30 readings (29.1–29.8) earlier this week. It is making higher lows while price makes lower lows, but it is still below 50 and has not left bearish territory. [Neutral]
- 20 EMA: The data gives EMA 13 at $164.01 and EMA 34 at $170.43. Price at $162.82 is below both, and EMA13 is below EMA34 with a widening gap, so both act as overhead resistance. Price is only slightly above VWAP ($161.27). [Bearish]
- MACD: Line -4.138, signal -4.461, histogram slightly positive. The line crossed back above the signal on the last bar and has risen for three straight bars. The cross is still deep below zero, so it signals a relief bounce rather than a trend change. [Bullish]
- Bollinger Bands (20): Upper $178.79, lower $155.18, mid-band roughly $167. Price sits in the lower third after a capitulation wick to about $149 and has not closed outside the lower band. The bands are wide, so volatility is elevated. A move back toward the mid-band is the mean-reversion case. [Neutral]
- CMF (20): +0.309 and rising, well above +0.05. Money flow has turned strongly positive during the selloff, a clear divergence from price and a sign of dip-buying or accumulation. [Accumulation]
- ADX (14): 37.7 and rising, with -DI (36.2) well above +DI (16.1). This is a strong downtrend. The -DI spread has narrowed from 54.9 to 36.2, which means selling pressure is fading but bulls have not taken control. [Strong Trend – Bearish]
- Volume: 350.45M, elevated and well above the October baseline. The huge spike on the flush low looks like capitulation, and recent bars show fading selling volume with a few green bars. [Capitulation / stabilizing]
DIVERGENCES & TRENDS
- Bullish divergences: RSI and MACD are making higher lows against lower price lows, and CMF has surged to +0.31 against falling price.
- Trend: The long-term trend is firmly down. Price is about 20% below the declining SMA50 ($214.65) and about 20% below the SMA200 ($204.19). The SMA50 is rolling over toward a death cross, and EMA13 stays below EMA34.
- Crossovers: MACD has just crossed bullishly, but below zero. -DI is still far above +DI with no DI crossover.
- Price action: Price has been basing in a tight $160–$166 range for about 3 sessions after the capitulation flush, holding just above VWAP.
CHART PATTERNS
- Possible Bullish Falling Wedge / base (reversal): The long descending channel with lower highs and decelerating momentum resembles a falling wedge. A break above the upper trendline, near EMA13 and then $166, would confirm it and target the EMA34 and mid-band area around $170.
- Bearish Flag risk (continuation): The tight sideways drift after a sharp drop could be a bear flag. A close below $160 and the $155 lower band would project a measured move toward the $150 flush low or below.
- The evidence leans toward a relief bounce, but the larger trend has not yet been broken.
POTENTIAL SCENARIOS
- Scenario 1: Bullish Relief Bounce — Positive CMF, the fresh MACD cross and a fading -DI support a mean-reversion move toward the EMA34 and mid-band. Trigger: close above EMA13 ($164.01) and then $166. Target: $166.50–$170.40. Invalidation: close below $160.20. (47% probability)
- Scenario 2: Bearish Trend Continuation — The strong ADX downtrend resumes as rallies fail at the EMA13 and EMA34. Trigger: rejection at $164–$166 and a break below $160.20. Target: $155.18 (lower band), then $150. Invalidation: close above $170.43. (38% probability)
- Scenario 3: Neutral Consolidation — Price chops between $160 and $166 as the base builds. Trigger: failure to break either side. Target: $161–$165. Invalidation: a close outside $159–$167. (15% probability)
PRICE TARGETS
- Target Price: $166.50 (6-day)
- Expected Range: $157.50 to $170.00 (width $12.50, about 7.7% of current price, consistent with the 7–10 day guidance scaled for 6 days)
- Key Levels: Support at $160.20 (recent closing lows; the lower Bollinger Band at $155.18 is next), Resistance at $170.43 (EMA34). Minor resistance sits at $164.01 (EMA13).
OVERALL BIAS
OVERALL BIAS: BULLISH - Strongly positive CMF (+0.31), a fresh MACD bullish cross, and higher RSI lows after a capitulation flush favor a relief bounce toward $166–$170. Conviction is modest because ADX is 37.7 with -DI dominant, and price is below all key moving averages.
This is educational analysis and not financial advice.