NVDA 4-day bullish forecast — Nov 15, 2026
- Bias: Bullish
- Timeframe: 4 days (made Nov 15, 2026, target date Nov 18, 2026)
- Price at analysis: $162.82
- Price target: $165.30
- Expected range: $159.00 – $168.00
- Result: Pending — graded after the close on Nov 18, 2026
Get a free AI analysis of NVDA today
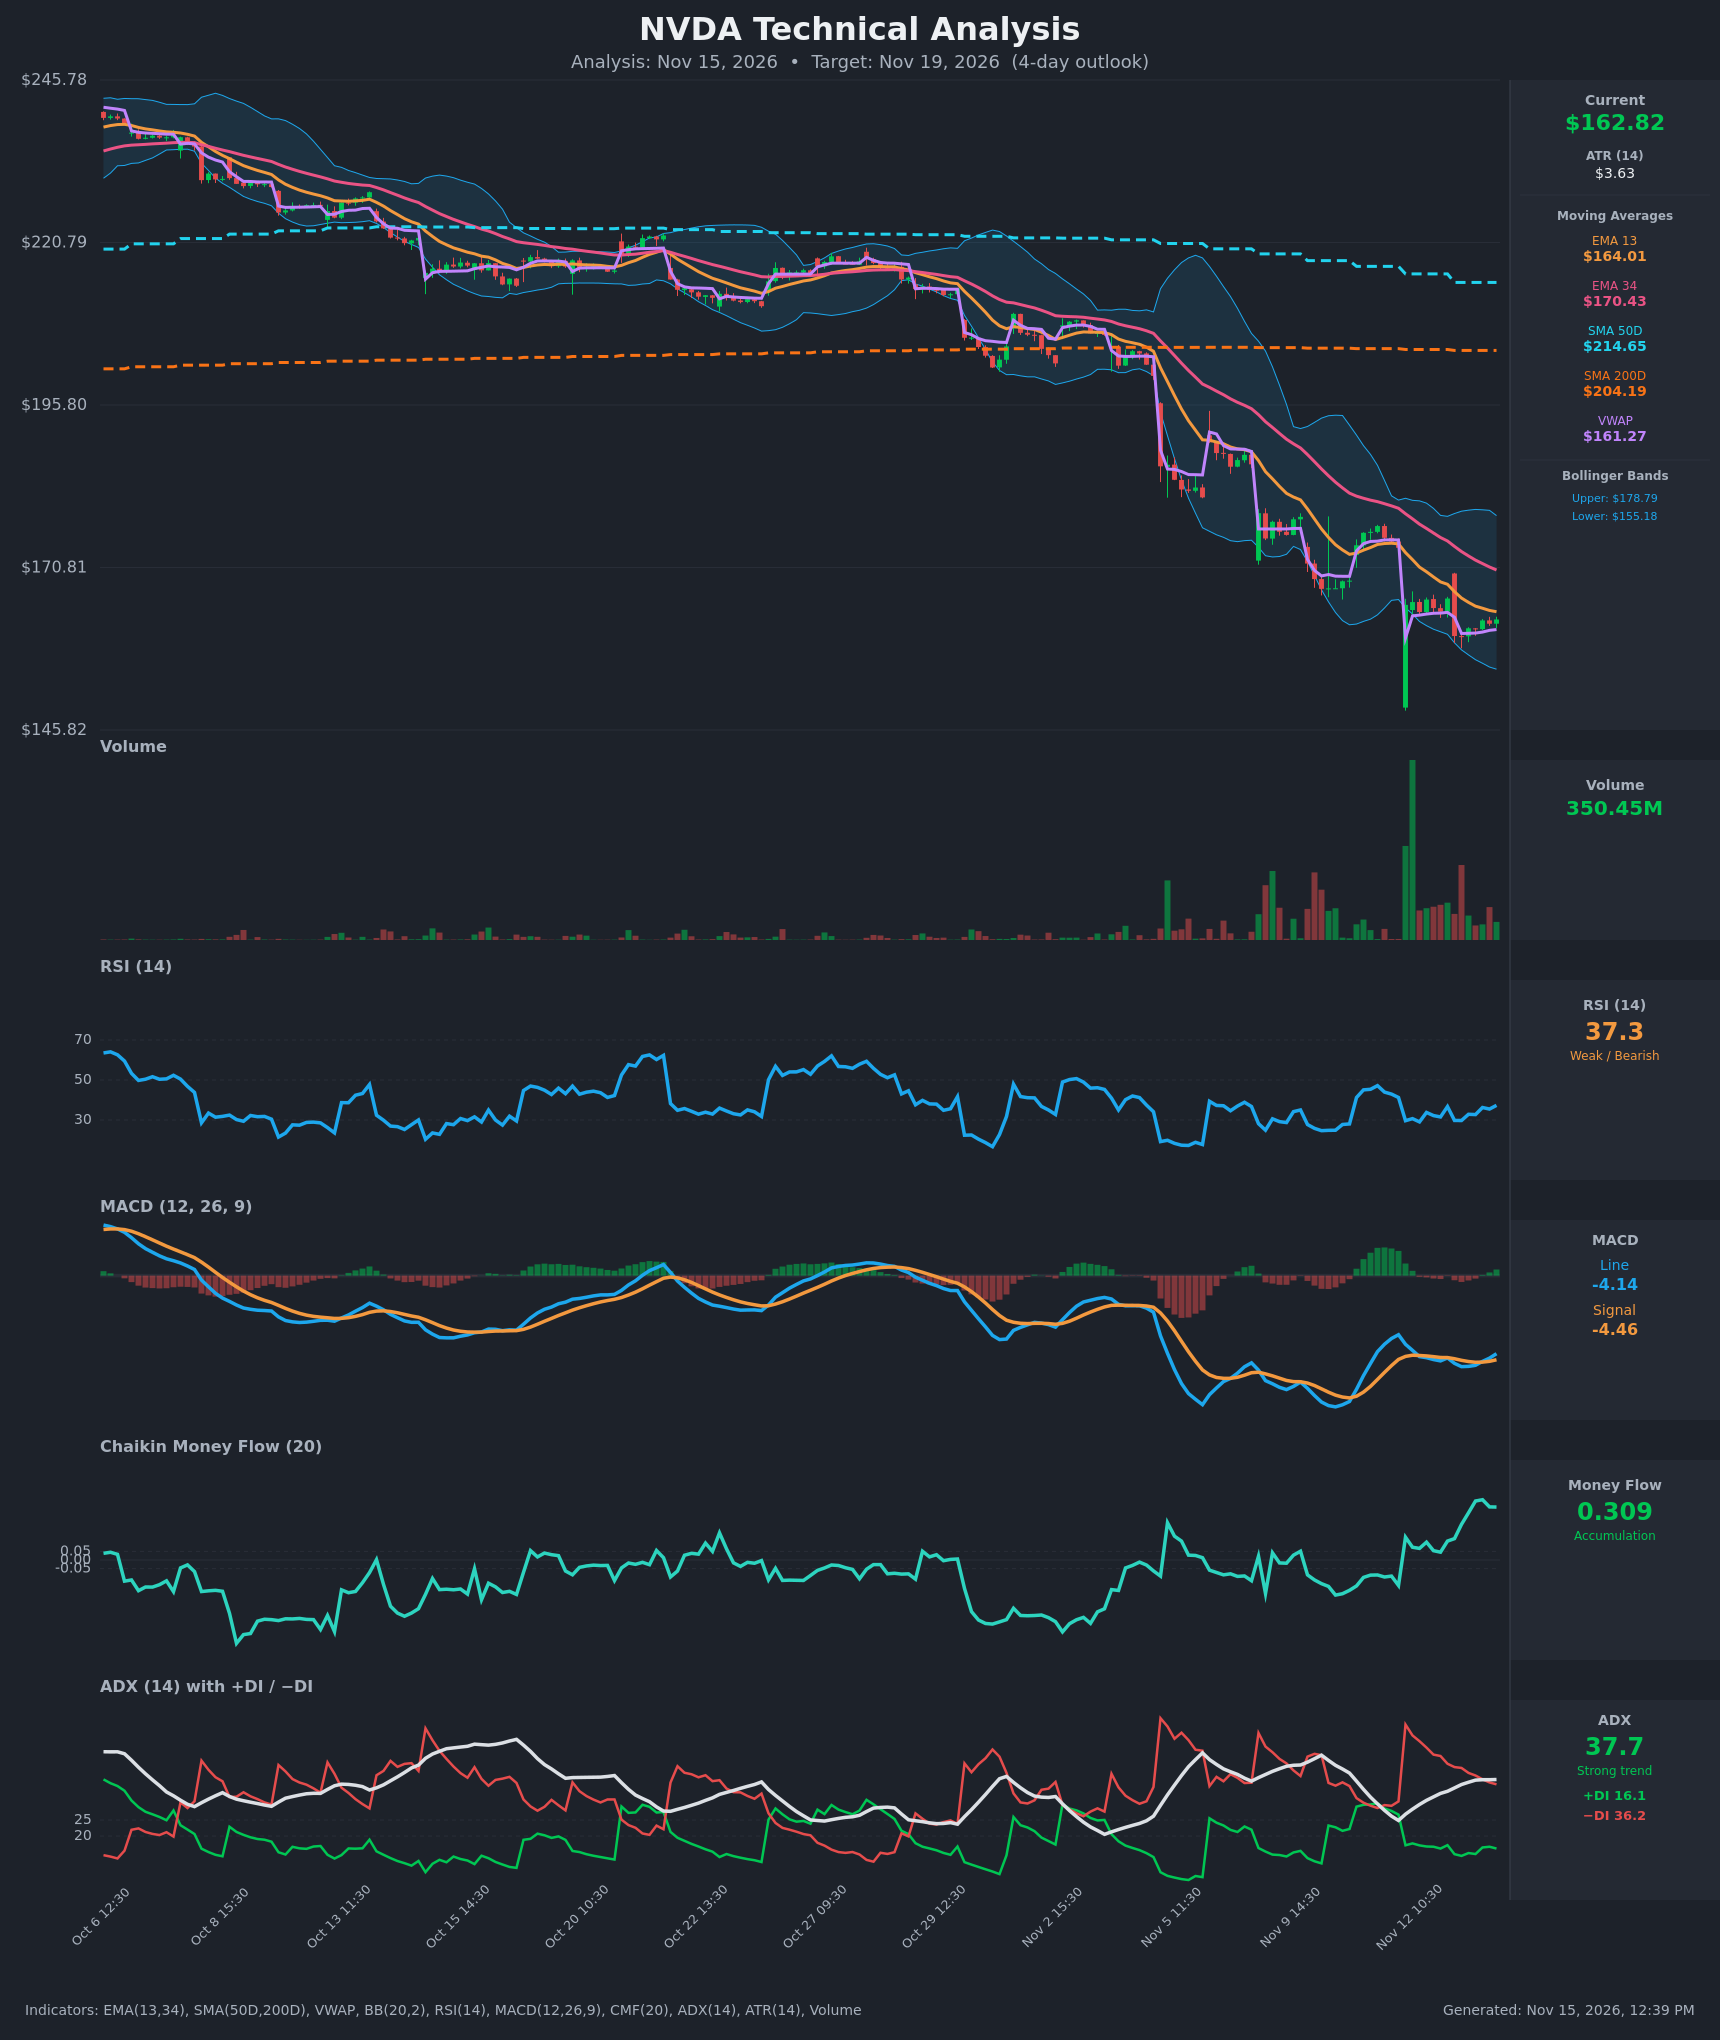
Analysis
TECHNICAL INDICATORS
- RSI (14): 37.32, up from 29.7–29.8 at the Nov 12–13 opens. It is still below 50, but it has recovered off oversold with higher lows. Momentum is improving inside a downtrend. [Neutral]
- 20 EMA (EMA 13 / EMA 34 provided): Price of $162.82 is below EMA13 ($164.01) and EMA34 ($170.43), so both act as overhead resistance. EMA13 is still sloping down, but price is now within about 0.7% of it, and the gap to EMA13 has narrowed from about $9 on Nov 11. EMA13 is below EMA34, so the bearish alignment holds. [Bearish]
- MACD: Line is -4.138 and signal is -4.461. The line crossed above the signal on the Nov 13 13:30 bar, a bullish crossover, and the histogram has turned slightly positive. Both lines are still deeply negative, so this is a relief signal rather than a trend reversal. [Bullish]
- Bollinger Bands (20): Upper is $178.79 and lower is $155.18, so the midline is about $167. Price sits in the lower third of the bands after riding the lower band, and the bands are wide from the recent volatility spike. A reversion toward the midline near $167 is plausible if the selling stays exhausted. [Neutral]
- CMF (20): 0.309, well above +0.05 and climbing sharply on the chart. It shows strong accumulation despite the price decline, and it is diverging positively from price. [Accumulation]
- ADX (14): 37.7 with −DI at 36.2 and +DI at 16.1. The trend is strong and bearish, with −DI on top. −DI has fallen from 54.9 to 36.2, so selling pressure is easing even though the trend is still intact. [Strong Trend – Bearish, weakening]
- Volume: Latest bar is 350.45M. The chart shows a huge capitulation spike on Nov 12 at the open, with a long lower wick toward about $150. Volume has stayed above the earlier baseline since, but recent bars are fading. Large volume at the low with a rejection of the lows suggests selling exhaustion. [Capitulation / Stabilizing]
DIVERGENCES & TRENDS
- Bullish CMF divergence: CMF has risen from negative to +0.31 while price made lower lows, which points to dip buying.
- RSI: Price retested the $160 area on Nov 13, but RSI held higher (about 30 versus 29.7 earlier and now 37). This is a mild improvement rather than a clean divergence.
- MACD: A bullish line/signal crossover has just formed from deeply negative levels. It is early and unconfirmed.
- Trend structure: Price is far below SMA50D ($214.65) and SMA200D ($204.19), which is a long-term downtrend. SMA50D is still above SMA200D, but the two are converging, so a death cross is a risk on a longer horizon.
- DI lines: −DI is still more than double +DI. There is no DI crossover, so bulls have not taken control.
- VWAP: Price is slightly above VWAP ($161.27), a minor sign of buyers defending the intraday anchor.
CHART PATTERNS
- Bearish Flag / Pennant (continuation): After the sharp drop, price has consolidated in a tight $160–$166 range. If it breaks below about $160, the measured move points toward the lower Bollinger Band at $155 and possibly the $150 capitulation low.
- Bullish Falling Wedge / Double Bottom (reversal, early): Retests of $160.2 on Nov 13 held above the capitulation spike, with improving CMF and MACD. A close above $166–$167 would confirm a relief move toward EMA34 at $170.
- The reversal reading is unconfirmed, and the dominant trend is still down. The 4-day move is more likely a relief bounce than a trend change.
POTENTIAL SCENARIOS
- Scenario 1: Bullish Relief Bounce — Accumulation (CMF +0.31), the MACD crossover, and a fading −DI support a mean-reversion bounce toward EMA13/Bollinger midline. Trigger: hold above $160 and close above EMA13 ($164.01), then above $166. Target: $166–$168, with an extension to EMA34 near $170.4. Invalidation: close below $160. (50% probability)
- Scenario 2: Bearish Trend Continuation — The strong downtrend (ADX 37.7, −DI dominant, price below all MAs) resumes after a failed bounce at EMA13. Trigger: rejection at $164–$166 and a break below $160. Target: $155.2 (lower BB), then $150. Invalidation: close above $166.5. (33% probability)
- Scenario 3: Neutral Consolidation — Price chops between $160 and $166 as the market digests the capitulation. Trigger: low-volume overlap of the recent candles. Target: $162–$164. Invalidation: a close outside $159–$168. (17% probability)
PRICE TARGETS
- Target Price: $165.30 (4-day, Nov 19)
- Expected Range: $159.00 to $168.00 (width $9.00, about 5.5% of current price, appropriate for a 4-day horizon and roughly consistent with ATR of $3.63 × √4 ≈ $7.3)
- Key Levels: Support at $160.00, Resistance at $166.00
OVERALL BIAS
OVERALL BIAS: BULLISH - Strong accumulation (CMF +0.31), a fresh bullish MACD crossover, RSI recovering from oversold, and price holding above VWAP after a high-volume capitulation wick favor a relief bounce toward $165–$168. Conviction is modest because the ADX downtrend is strong and price is still below every major moving average.
This is educational analysis and not financial advice.