SOXL 6-day bearish forecast — Nov 15, 2026
- Bias: Bearish
- Timeframe: 6 days (made Nov 15, 2026, target date Nov 20, 2026)
- Price at analysis: $58.35
- Price target: $55.80
- Expected range: $52.00 – $61.00
- Result: Pending — graded after the close on Nov 20, 2026
Get a free AI analysis of SOXL today
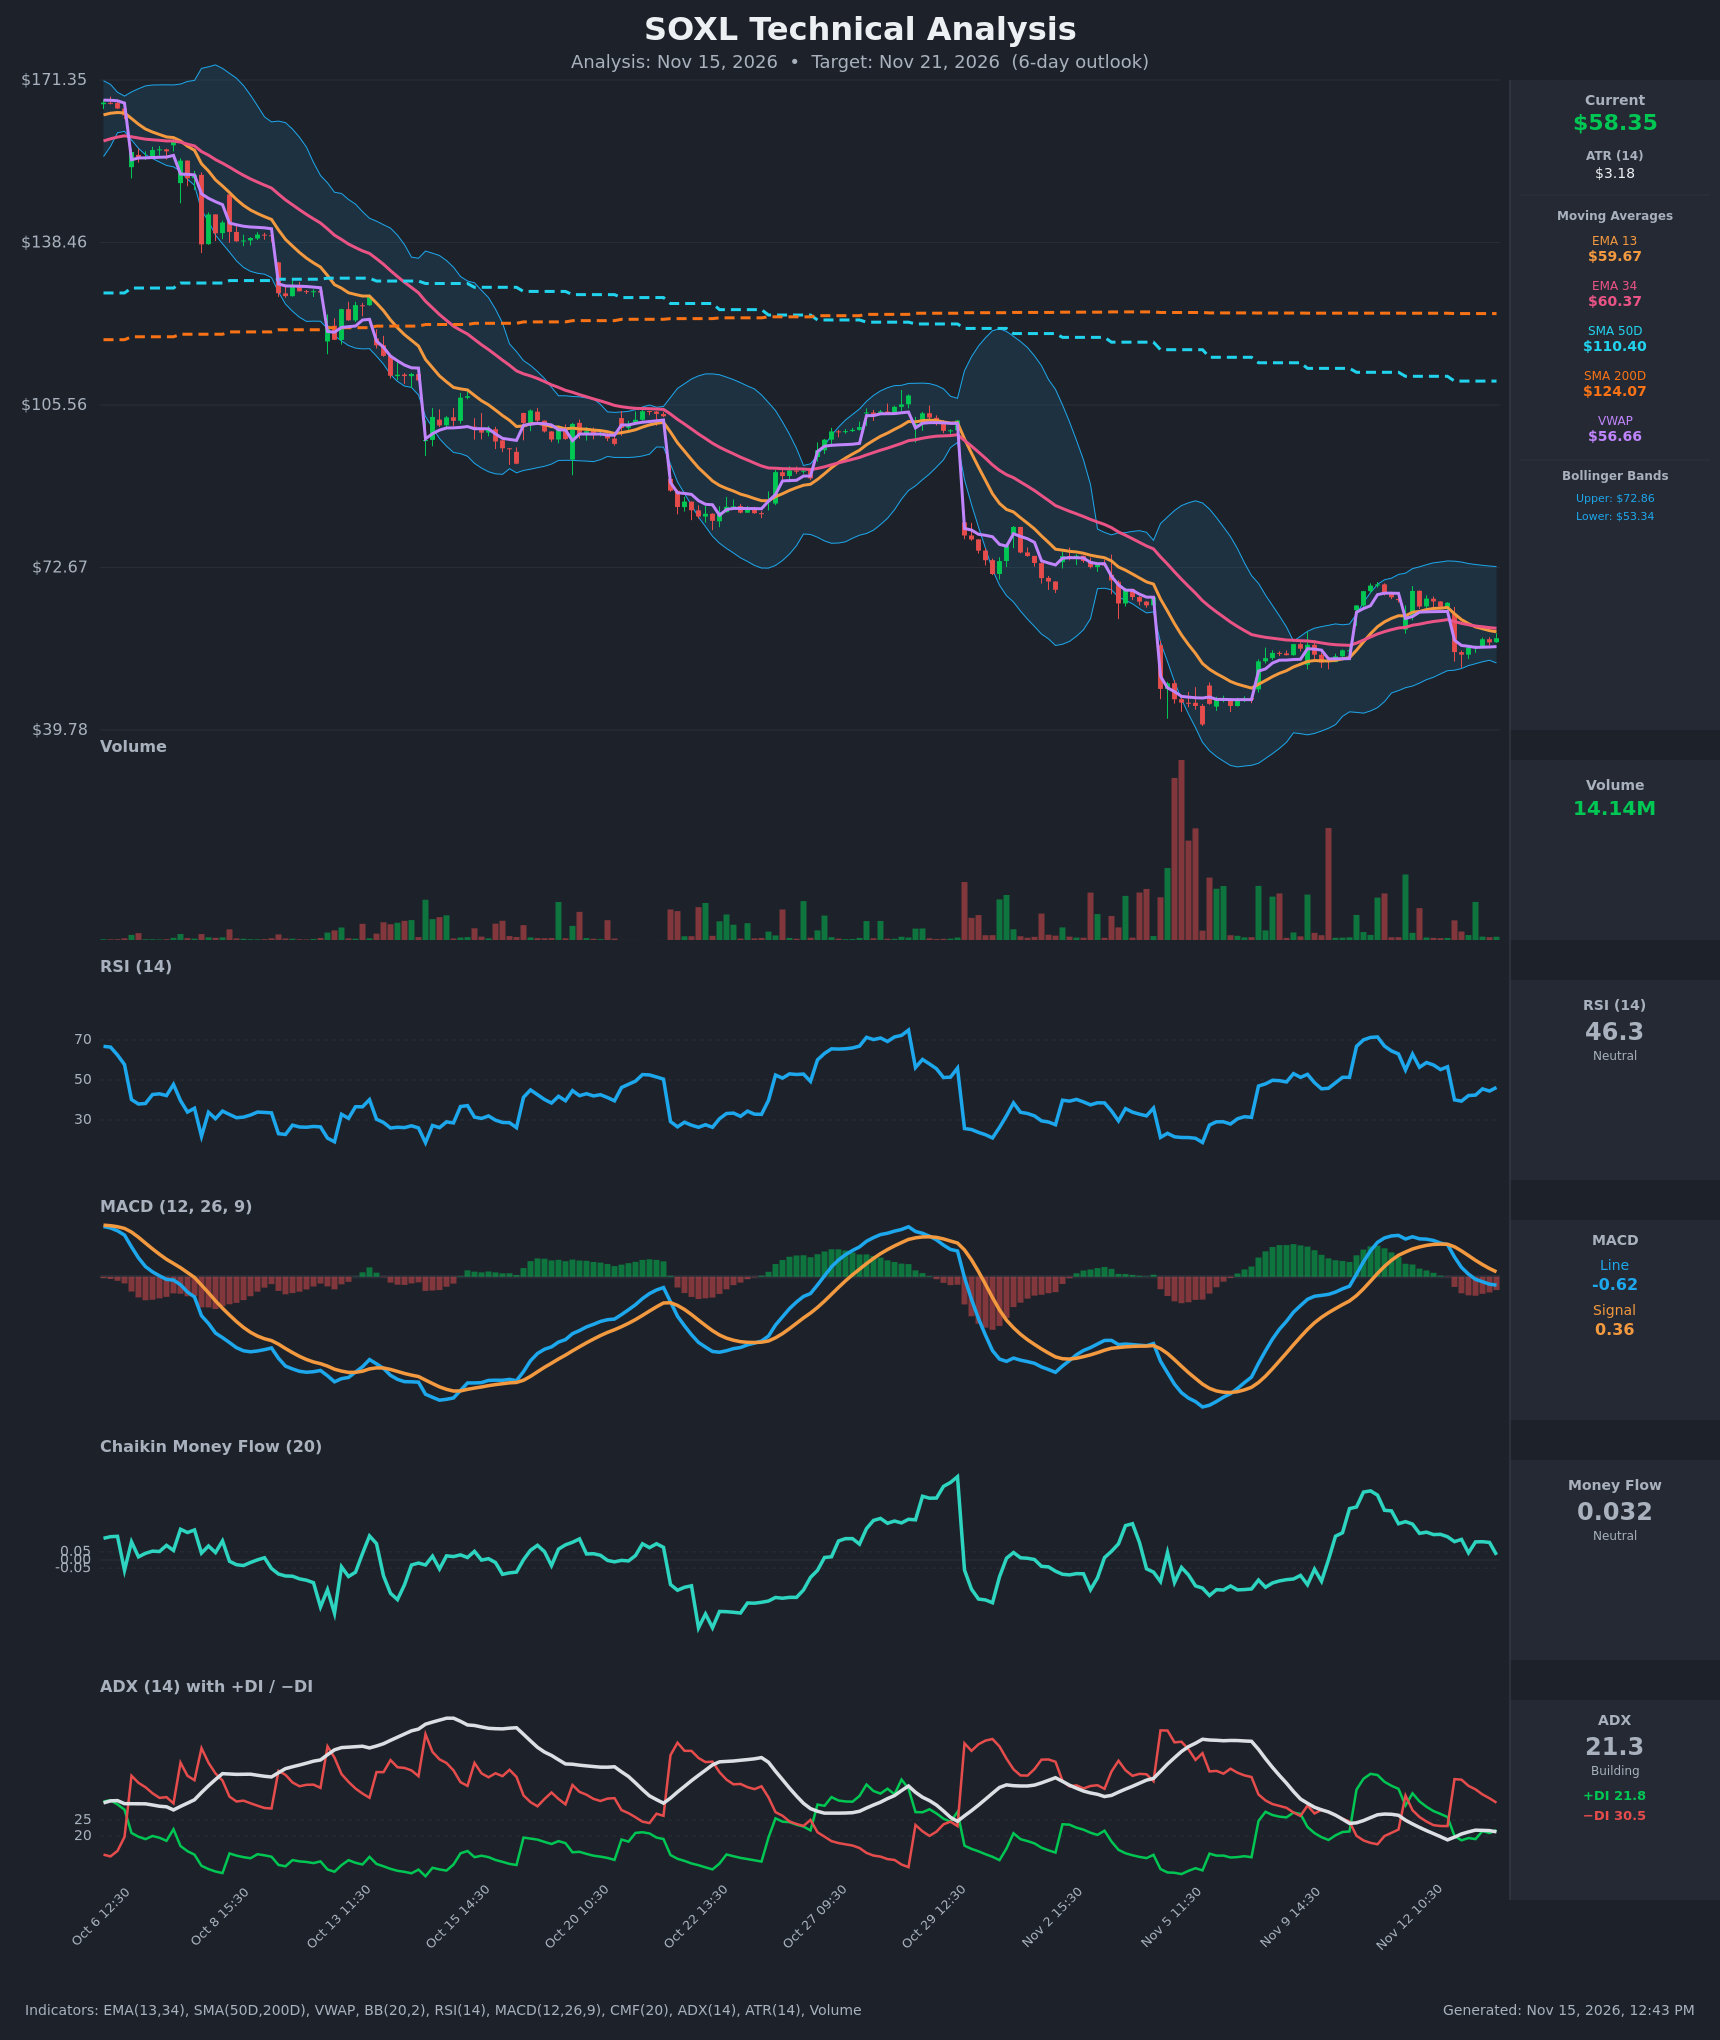
Analysis
TECHNICAL INDICATORS
- RSI (14): 46.28, down from 56–63 earlier in the week and now below the 50 midline. It dropped sharply on the Nov 13 gap down (40.1) and has bounced only modestly since. Momentum is soft and leans slightly bearish. [Bearish]
- 20 EMA: The supplied EMAs are 13 and 34. EMA13 is $59.67 and EMA34 is $60.37, and price at $58.35 is below both. EMA13 crossed below EMA34 on Nov 13 (a bearish cross), so both now act as overhead resistance. [Bearish]
- MACD: The line is -0.62 against a signal of 0.36, so it crossed below the signal on Nov 13 and has widened to a negative histogram of about -0.98. The line has also dropped below zero. That is a fresh bearish momentum signal, though the pace of decline is slowing. [Bearish]
- Bollinger Bands (20): Upper $72.86, lower $53.34, midline about $63.10. Price sits in the lower half of the bands, below the midline, with room before the lower band. Bandwidth is wide after recent volatility. [Bearish]
- CMF (20): 0.032, inside the neutral band (±0.05) and fading from 0.11 and from the 0.22 reading on Nov 11. Buying pressure is evaporating but there is no outright distribution yet. [Neutral]
- ADX (14): 21.3 with −DI at 30.5 above +DI at 21.8. The trend is weak-to-moderate, but the bears control direction. The −DI/+DI spread has narrowed from 37.8 vs 20.0 at its worst. [Weak Trend, Bearish direction]
- Volume: 14.14M, with no surge on the bounce. Heavy selling came on the gap down. Price is also slightly above VWAP ($56.66), a minor intraday-support offset. [Neutral to mildly Bearish]
DIVERGENCES & TRENDS
- Long-term trend: Price is far below SMA50D ($110.40) and SMA200D ($124.07). The SMA50D is below the SMA200D, so a death cross is already in place, and the major downtrend is intact. The chart shows a decline from about $171 to a low near $40.
- Rebound structure: Price bounced from about $40 to about $68, then rolled over. The Nov 13 gap down from $65.53 to $55.55 broke the short-term uptrend, and the subsequent recovery has been shallow, capped by the EMAs.
- Crossovers: EMA13 below EMA34 (bearish), MACD below signal and zero line (bearish), and −DI above +DI after the Nov 12 flip (bearish).
- Divergences: No clear divergence. RSI and MACD are confirming the lower price action. CMF staying marginally positive while price fell is a mild bullish hint but is fading.
- ADX: Falling toward 20, so the rebound trend is exhausted and the market is in a transition or range phase, while −DI dominance favors downside bias.
CHART PATTERNS
- Bearish Rising Wedge / Bearish Flag (loose fit): The advance from $40 to $68 with higher lows and a rollover resembles a corrective rally within the larger downtrend. The gap below $56 acts like a breakdown of that structure.
- Large-scale downtrend (continuation): The bigger picture is a series of lower highs and lower lows. The recent bounce looks like a bear-flag-type relief rally, which suggests continuation lower with a measured target toward the lower Bollinger Band area ($53) and possibly retesting the $50 area.
- Near-term: A small consolidation just above the $55 gap-day lows. A break below $55 would confirm the bearish continuation. Resistance is $59.7–$60.4 (EMAs) and then the Nov 12 gap zone near $65.
POTENTIAL SCENARIOS
- Scenario 1: Bearish Continuation Lower — Price fails at the EMA13/34 cluster ($59.7–$60.4) and rolls over, with MACD and −DI dominance pulling price back to the gap-day lows and the lower Bollinger Band. Trigger: Rejection at $60 or a break below $55. Target: $52–$54, with an extension toward $50. Invalidation: A daily close above $61 with rising volume. (50% probability)
- Scenario 2: Neutral Range Chop — ADX is low and price oscillates between $55 and $60.4, pinned around VWAP and the EMAs. Trigger: Failed breaks of both $55 and $60.4. Target: $56–$60. Invalidation: Close outside $54.5–$61.5. (22% probability)
- Scenario 3: Bullish Relief Bounce — A leveraged-ETF oversold bounce pushes price above the EMAs and fills part of the gap. Trigger: Reclaim of $60.4 with volume and a MACD histogram turn. Target: $63–$65. Invalidation: Failure back below $58. (28% probability)
PRICE TARGETS
SOXL is a 3x leveraged ETF with an ATR of $3.18 (about 5.4% of price), so a 6-day move can be large. The 6-day range is set at about 7.5 dollars wide on a roughly 4–8% guideline plus volatility, which works out to around 14–15% of price given the ATR. The width is $8.00 (13.7%), which is wider than the 7–10 day guideline but justified by the ATR (a 6-day 1-sigma move is about $7.8). To stay closer to the guideline, the core range is set at $54.00 to $62.00 ($8.00 width, 13.7%).
- Target Price: $55.80 (6-day target)
- Expected Range: $52.00 to $61.00
- Key Levels: Support at $55.00, Resistance at $60.37
Self-check: Range width is $9.00, or about 15.4% of the current price. That is above the 4–8% base guideline for 7–10 days, but it is justified by the leveraged nature of the ETF and its ATR of about 5.4% per bar-day. It is clearly wider than a 2–3 day range would be.
OVERALL BIAS
OVERALL BIAS: BEARISH - Price is below EMA13/EMA34 after a bearish EMA cross, MACD has crossed below the signal line, −DI dominates +DI, RSI is below 50, and the long-term trend (death cross, price far below SMA50D/SMA200D) is down. The $55 gap-day low is the near-term level to watch for continuation toward the lower Bollinger Band.
This is educational analysis and not financial advice.