SOXS 6-day bearish forecast — Nov 15, 2026
- Bias: Bearish
- Timeframe: 6 days (made Nov 15, 2026, target date Nov 20, 2026)
- Price at analysis: $50.79
- Price target: $49.50
- Expected range: $48.00 – $52.00
- Result: Pending — graded after the close on Nov 20, 2026
Get a free AI analysis of SOXS today
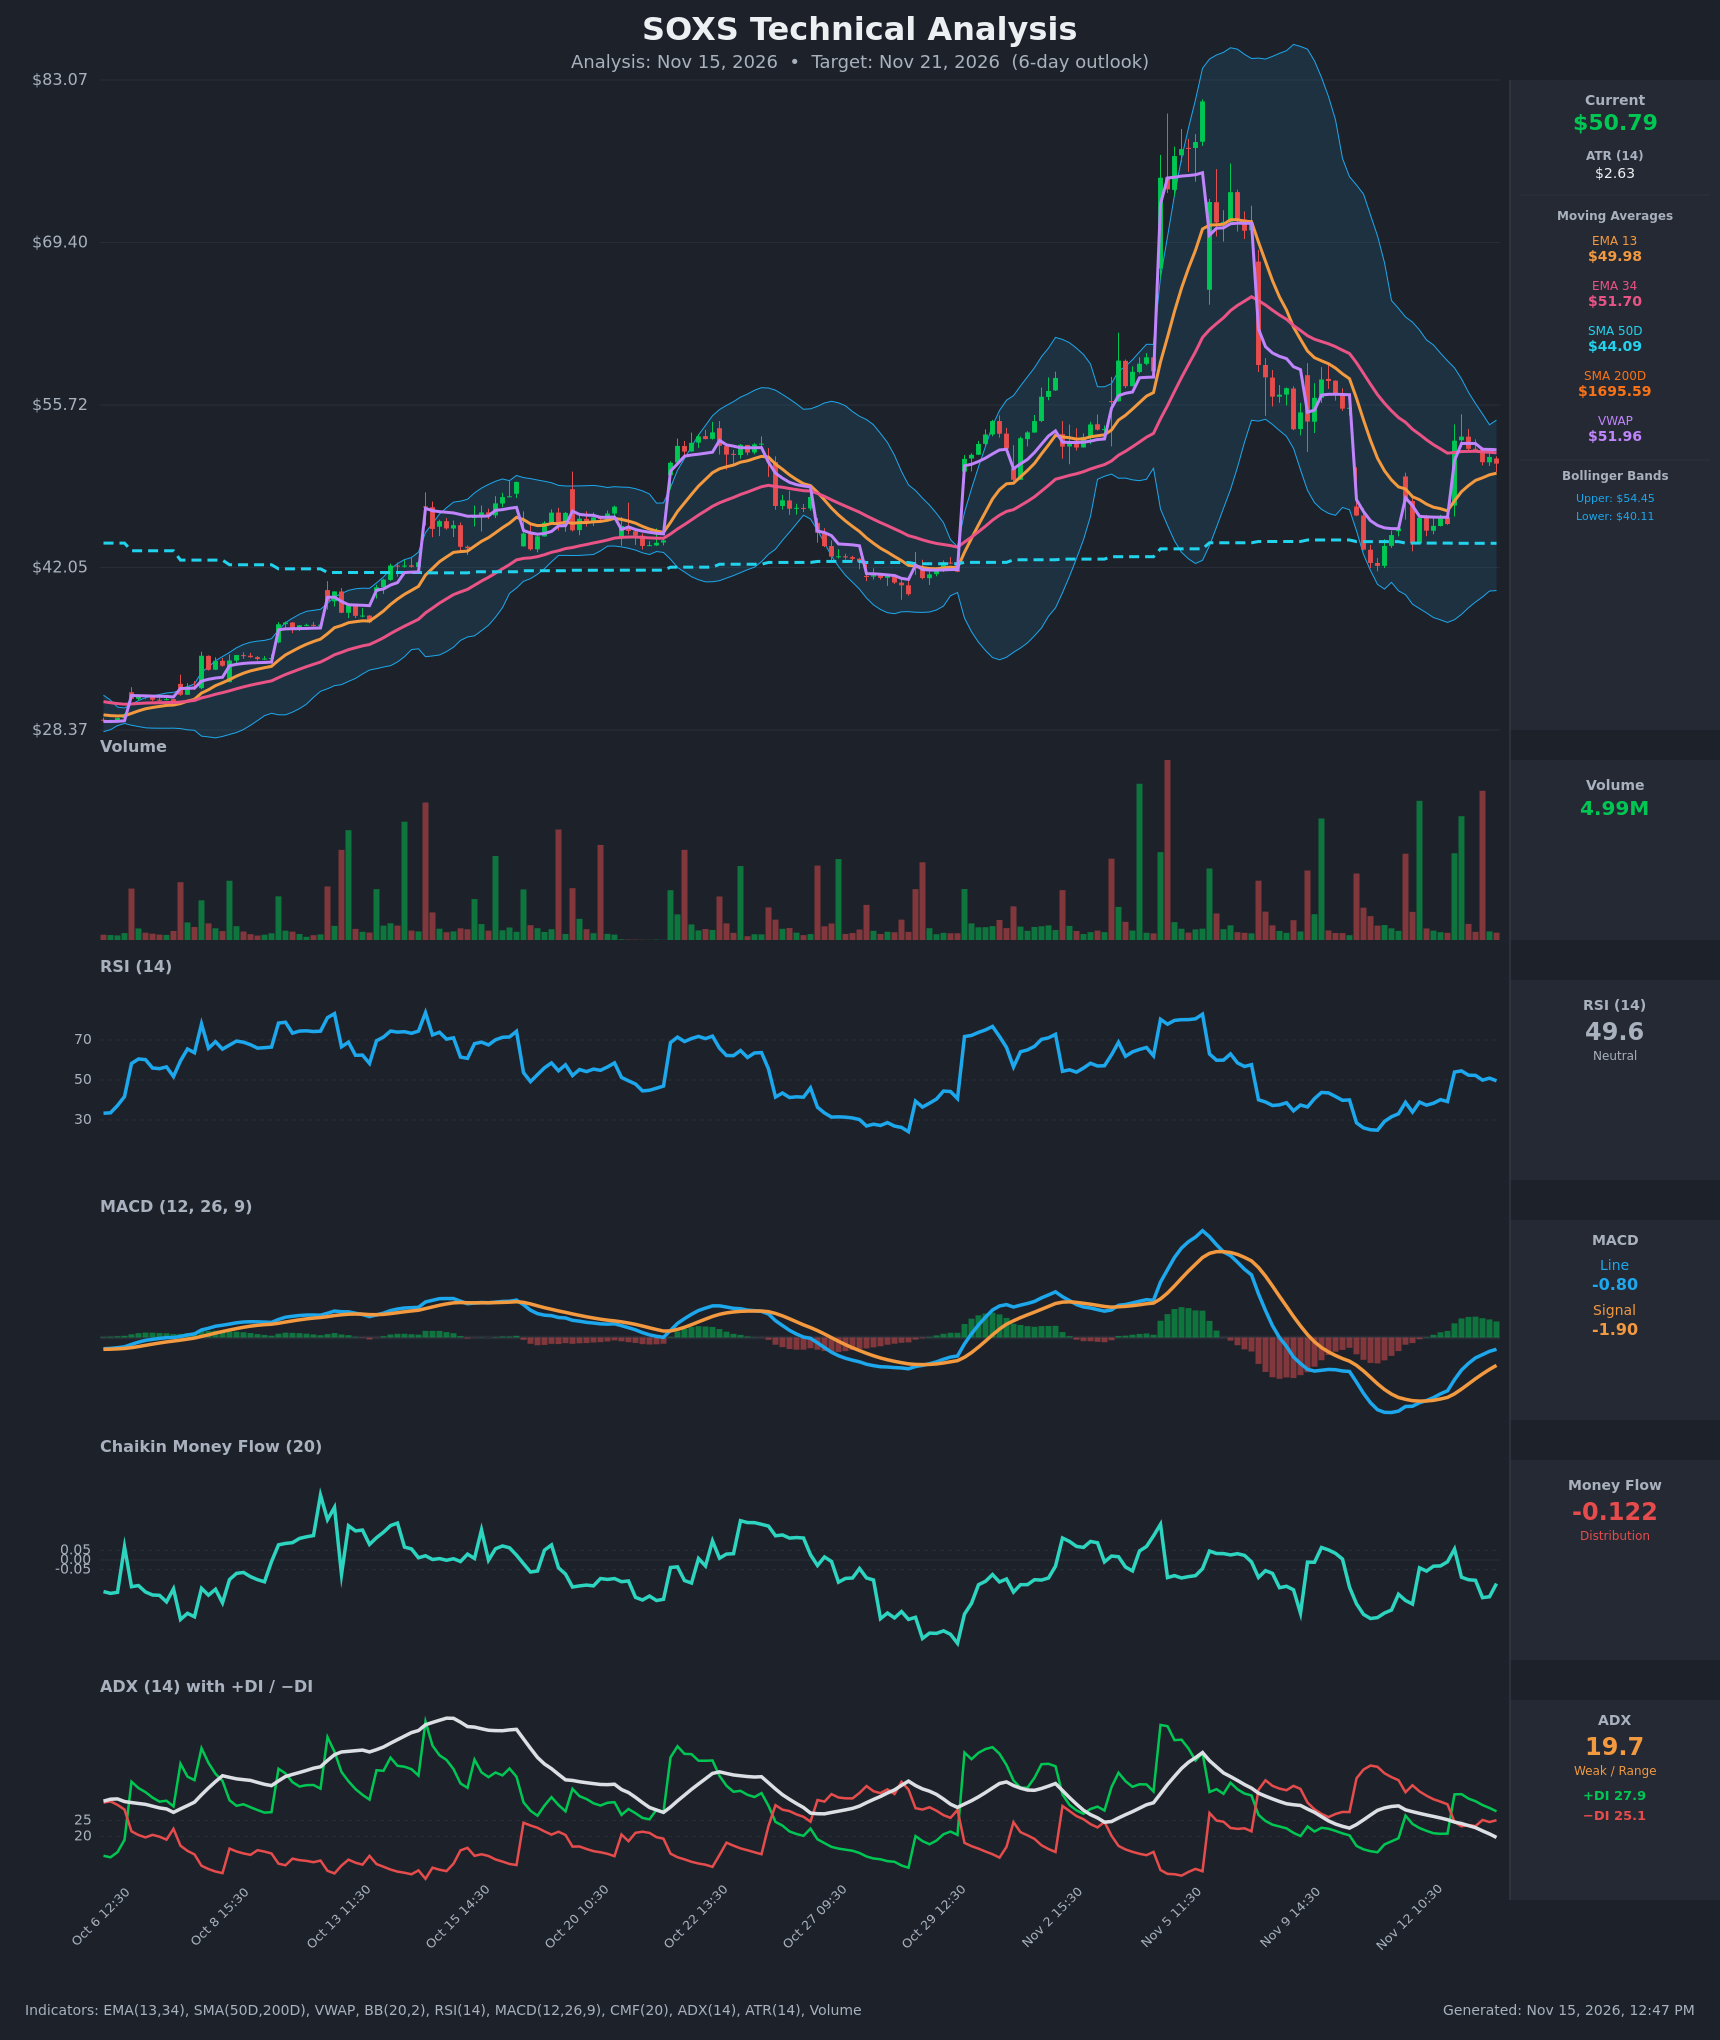
Analysis
TECHNICAL INDICATORS
- RSI (14): 49.59, right at the midline. It fell from 54.6 to 49.6 over the last few bars after spiking from 39 on the Nov 13 gap. The momentum direction is mildly down and there is no overbought or oversold signal. [Neutral]
- 20 EMA: The chart shows EMA 13 ($49.98) and EMA 34 ($51.70) instead. Price at $50.79 is above EMA13, which is short-term support, but below EMA34, which is resistance. EMA13 is still below EMA34 with the gap narrowing, so there has been no bullish cross yet. [Neutral]
- MACD: The line is -0.80 and the signal is -1.90, so the histogram is +1.10. The line crossed above the signal around Nov 12 and has been recovering. The histogram peaked near +1.23 and is now shrinking, so upward momentum is fading. Both lines remain below zero. [Neutral]
- Bollinger Bands (20): Upper $54.45, lower $40.11, with a very wide band from the earlier volatility spike. Price is slightly above the midline (about $47.3), in the upper-middle zone. Wide bands imply large potential swings but give no directional edge. [Neutral]
- CMF (20): -0.122, below -0.05 and negative for most of the last 15 bars, including during the gap-up session. That points to persistent distribution and selling into strength. [Distribution]
- ADX (14): 19.7 and falling, so the trend is weak and range-bound. +DI (27.9) is above -DI (25.1), but the spread has narrowed sharply from 33/23 on Nov 13. The bulls' edge is eroding. [Weak Trend, slight bullish DI lean fading]
- Volume: 4.99M, moderate and below the spike bars seen on the Nov 11-13 selloff and gap. There is no volume expansion supporting a breakout. Price is also below VWAP ($51.96), which shows sellers have control intraday. [Neutral to mildly bearish]
Note: SMA200D ($1695.59) looks like a data or split artifact, so I am ignoring it. SMA50D ($44.09) is well below price, a modest support reference.
DIVERGENCES & TRENDS
- Price gapped from ~$45.7 to $52.7 on Nov 13, then has made lower highs and lower closes since, down to $50.79. The gap is slowly fading.
- CMF stayed negative through the gap-up. Money flow did not confirm the rally, which is a mild bearish divergence.
- +DI and -DI are converging. A -DI cross above +DI would confirm the fade.
- MACD histogram is shrinking while the line is still below zero. Momentum from the bounce is stalling.
- Price is below VWAP and EMA34 and above EMA13. EMA13 is the pivot, and a close below it would shift short-term control to sellers.
- ADX is below 20, so the market is in a choppy, non-trending phase after the spike and crash.
CHART PATTERNS
- The large structure is a spike to ~$81 on Nov 5, a collapse to ~$42-44, and then a rebound. That leaves a broad consolidation range of roughly $44-$55.
- Since the Nov 13 gap, price has formed a small descending channel. This loosely resembles a Bullish Flag, which would target a measured move toward $53-55 if it breaks up through $52. It is weak because CMF, ADX and VWAP do not confirm it.
- The failed hold above VWAP and the fading gap also resemble a mild Bearish Pennant or failed breakout. A break below EMA13 (~$49.98) would open a retest of $47-$48 and possibly the gap zone near $45.7.
- Neither pattern is clean, so I treat the structure as range-bound with a slight downward skew.
POTENTIAL SCENARIOS
- Scenario 1: Bearish Gap Fade — Price keeps making lower highs under VWAP and EMA34, with CMF showing distribution and -DI crossing above +DI. Trigger: hourly close below EMA13 (~$49.98). Target: $47.50-$48.50, with an extension toward $45.70 (the gap origin). Invalidation: close above $52.00 (VWAP and EMA34 reclaimed). (45% probability)
- Scenario 2: Bullish Flag Breakout — The descending channel resolves upward and MACD turns up again with +DI widening. Trigger: close above $52.00 on rising volume. Target: $54.45 (upper Bollinger Band), with $55 as the extension. Invalidation: close below $49.00. (33% probability)
- Scenario 3: Neutral Range Chop — Weak ADX keeps price between EMA13 and EMA34 in a $49-$52 range. Trigger: no close outside $49.00-$52.00. Target: $50-$51. Invalidation: a decisive break of either boundary. (22% probability)
PRICE TARGETS
- Target Price: $49.50 (6-day)
- Expected Range: $48.00 to $52.00 (width $4.00, about 7.9% of the current price, in line with the guidance for a 6-day horizon)
- Key Levels: Support at $49.98 (EMA13), then $48.00. Resistance at $51.70 (EMA34), then $51.96 (VWAP).
OVERALL BIAS
OVERALL BIAS: BEARISH - The gap-up is fading with lower highs. Price is below VWAP and EMA34, CMF shows persistent distribution, the MACD histogram is shrinking, and the +DI/-DI spread is narrowing. ADX is weak, so conviction is modest and a bounce toward $52 is possible.
This is educational analysis and not financial advice.