SOXS 4-day bearish forecast — Nov 15, 2026
- Bias: Bearish
- Timeframe: 4 days (made Nov 15, 2026, target date Nov 18, 2026)
- Price at analysis: $50.79
- Price target: $49.40
- Expected range: $48.00 – $52.00
- Result: Pending — graded after the close on Nov 18, 2026
Get a free AI analysis of SOXS today
Analysis
TECHNICAL INDICATORS
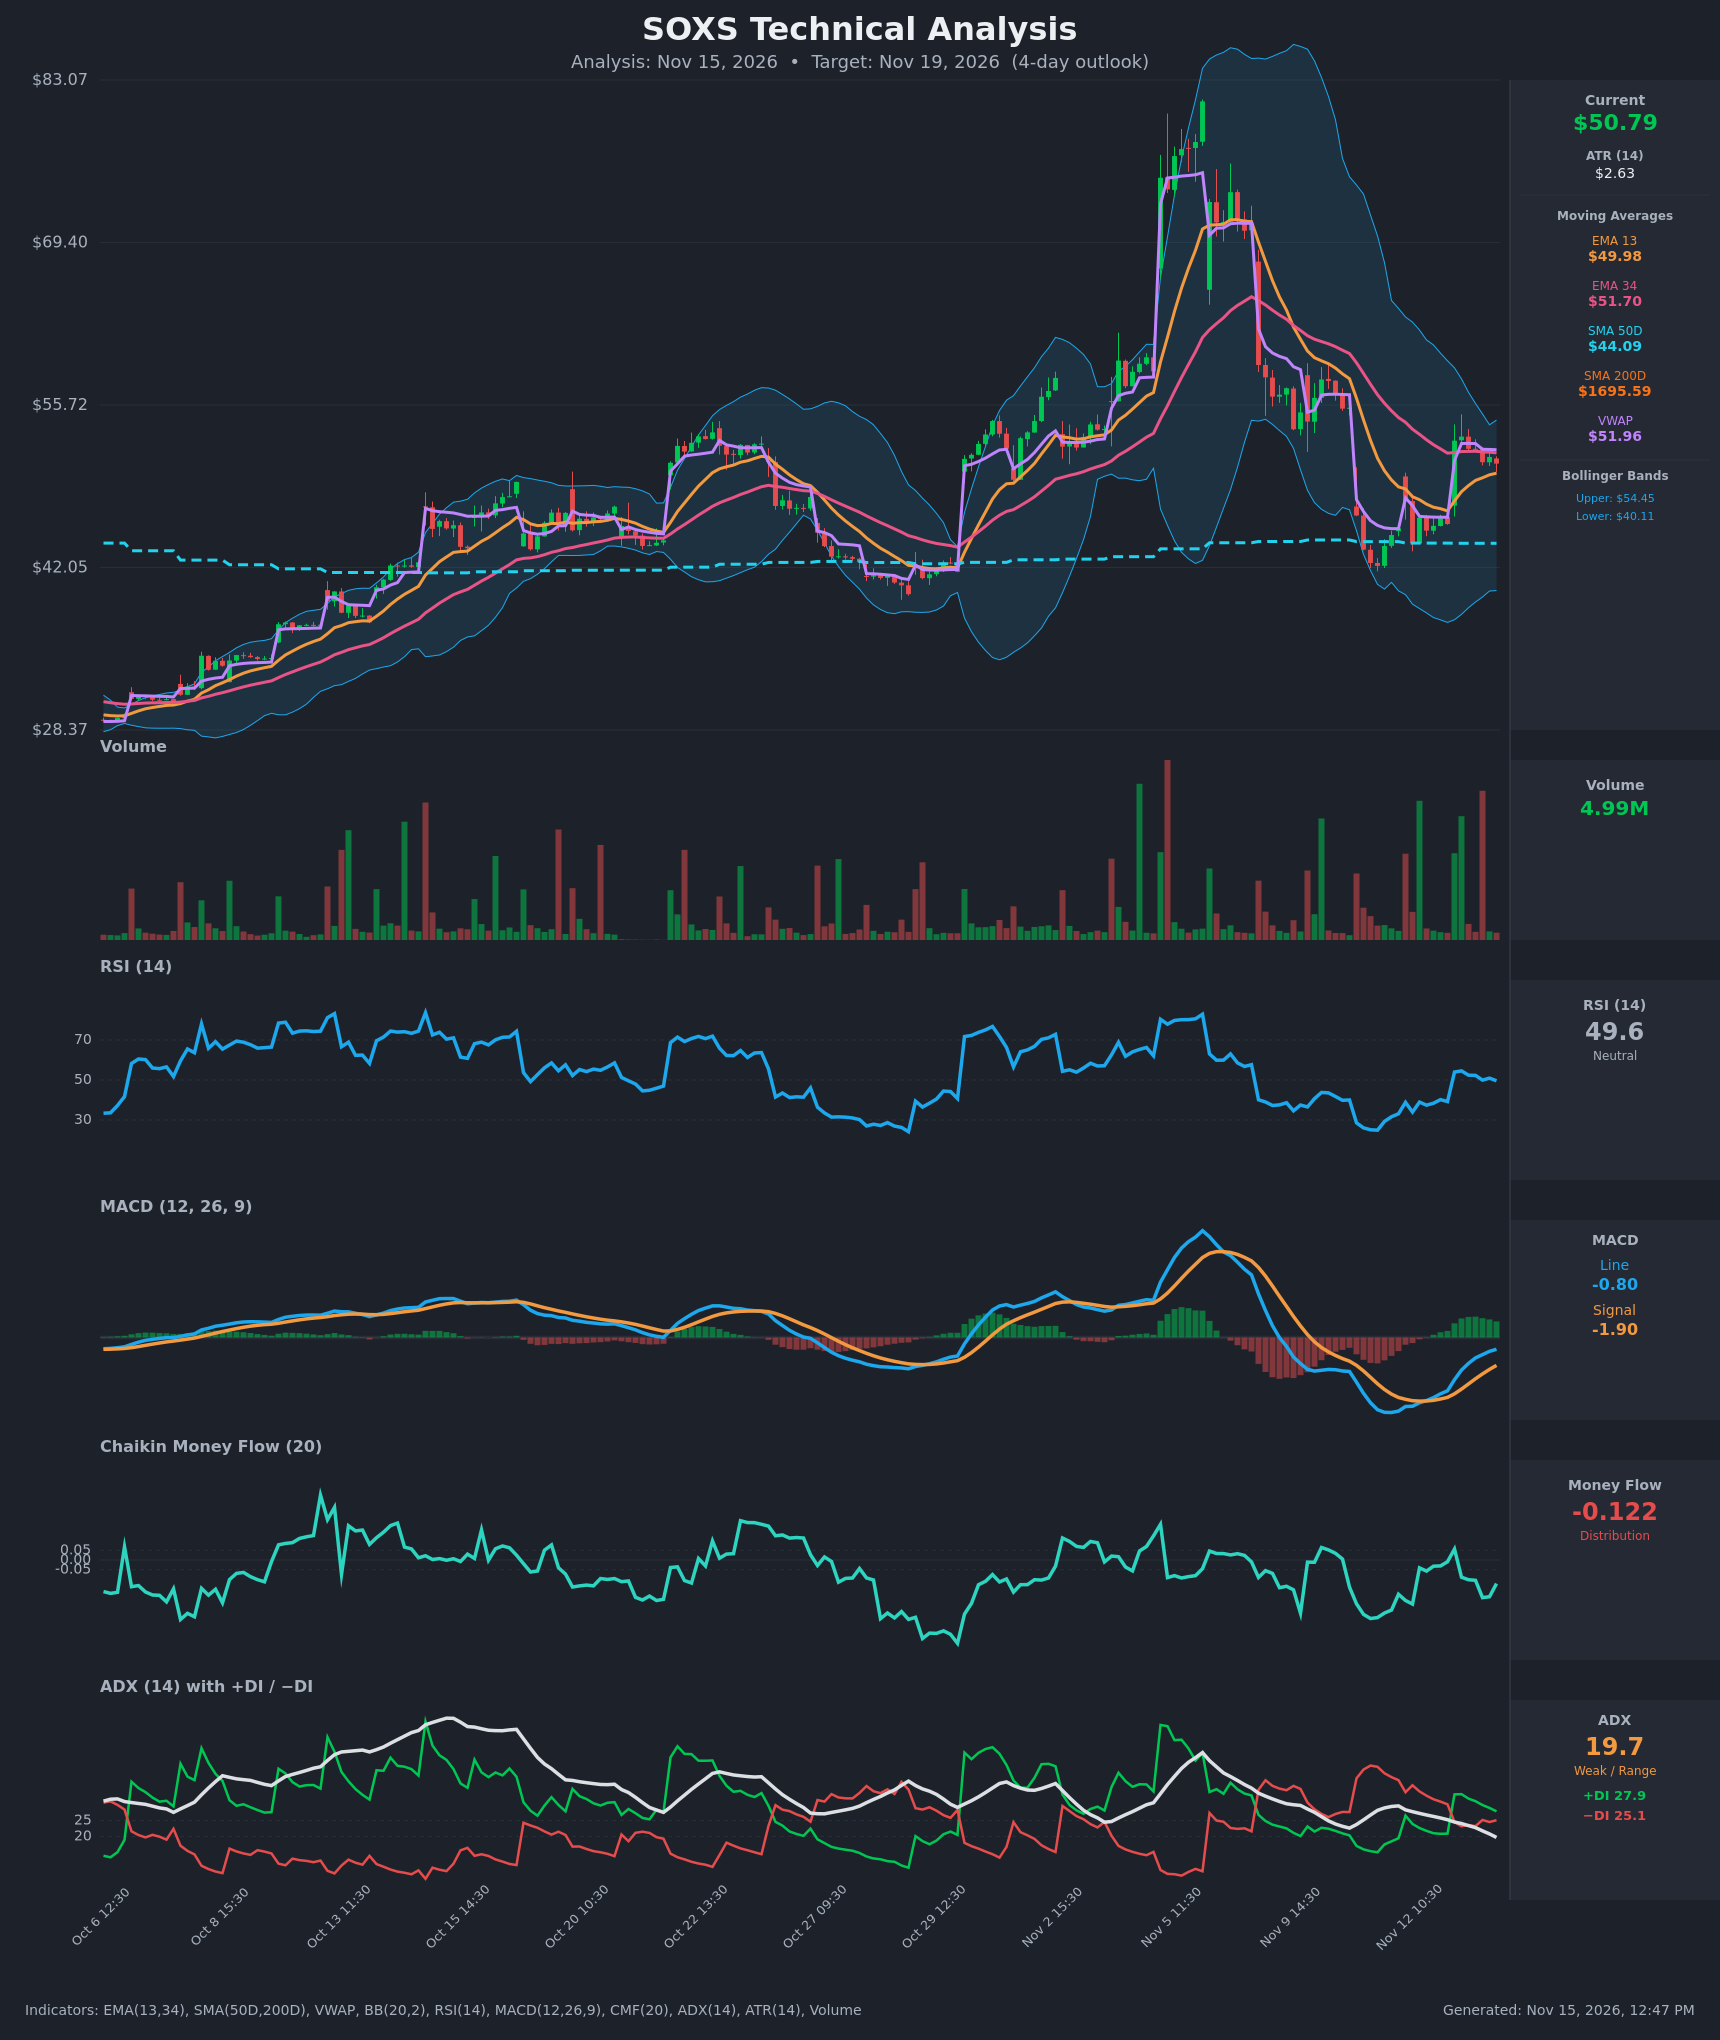
- RSI (14): 49.59, dead neutral. It has faded from 54.6 (Nov 13 10:30) while price made lower highs, so momentum is slowly leaking after the gap-up bounce from the 30s. [Neutral]
- 20 EMA (EMA 13 / EMA 34 used): EMA 13 is $49.98 and rising, and price ($50.79) is just above it, so it is the first support. EMA 34 is $51.70 and still sloping down, with price below it. EMA 13 is closing in on EMA 34 from below (bullish convergence), but there has been no crossover yet. [Neutral]
- MACD: Line -0.80, signal -1.90, histogram about +1.10. The line is below zero but has crossed above the signal and is climbing from -5.0. That is a bullish recovery, but the line's rise is flattening (-0.94 to -0.80 in the last bar), so the impulse is fading. [Bullish]
- Bollinger Bands (20): Upper $54.45, lower $40.11, midline about $47.28. Price sits in the upper-middle of a very wide band, so volatility is still elevated after the collapse from $80. There is no squeeze or band-edge signal, and the midline is a possible pullback magnet. [Neutral]
- CMF (20): -0.122, below the -0.05 threshold and negative on most recent bars, including through the Nov 13 rally. Rallies are being sold into, so this is distribution. [Distribution]
- ADX (14): 19.7 and falling from 29.6, which is weak/range-bound. +DI 27.9 is above -DI 25.1, but the gap has narrowed from 33.2 vs 23.2 (+10) to under 3 points. Bulls hold nominal control, but it is eroding. [Weak Trend, slight bullish tilt fading]
- Volume: 4.99M on the latest bar, below the large spikes at the Nov 12–13 gap and the earlier selloff. The drift lower from $53 to $50.79 came on modest volume, so there is no strong conviction either way. [Neutral / fading participation]
Other context:
- Price is below VWAP ($51.96), which is a selling-pressure signal.
- Price is above SMA50D ($44.09).
- SMA200D ($1695.59) is a data artifact, likely from reverse-split adjustment, so I am ignoring it.
DIVERGENCES & TRENDS
- Price has made lower highs since the Nov 13 open ($53.06 then $52.03, $51.98, $51.35). Closes are drifting down while the MACD histogram is positive. That is a mild short-term divergence: MACD has recovered, but price has not followed.
- CMF stayed negative (-0.19 to -0.12) through the bounce, confirming distribution and contradicting the improving MACD.
- RSI went from 54.6 to 49.6 in step with price, with no divergence.
- ADX is below 20 and the DIs are converging. A -DI crossover over +DI is a real possibility within the next few bars.
- There is no EMA 13/34 crossover. The gap has narrowed from about $5.7 to $1.7, so a bullish cross is possible if price holds.
- The MACD bullish crossover happened around Nov 12 14:30–15:30.
- The earlier pop above the 34 EMA failed to hold.
CHART PATTERNS
- Dominant structure: A sharp downtrend from about $80 to the mid-$40s, then a gap-up bounce into a $50–$53 consolidation with lower highs. This most resembles a Bearish Flag/Pennant or Descending Triangle-style pause, though the flag is only loosely formed and ADX is weak.
- A bearish resolution would break below EMA 13/$49.98 and then the $47–$48 zone (Bollinger midline and the Nov 13 gap origin). The measured target is the $45–$46 gap-fill and prior low area, beyond the 4-day horizon.
- Alternative: A Bullish Falling Wedge/Double Bottom from the $44–$45 lows. It is invalidated if price fails to reclaim EMA 34/VWAP at $51.70–$51.96. Confirmation needs a close above about $53.
- The pattern is low-confidence overall.
POTENTIAL SCENARIOS
- Scenario 1: Bearish Fade Toward the Gap — Price keeps making lower highs under VWAP and EMA 34. CMF distribution continues, and -DI crosses above +DI as ADX stays weak. Trigger: hourly close below EMA 13 ($49.98). Target: $48.50–$49.40, with an extension to $47.30 (Bollinger midline). Invalidation: close above $51.96 (VWAP) and $52.50. (45% probability)
- Scenario 2: Bullish Reclaim and Squeeze Higher — The positive MACD histogram and EMA 13 rising into EMA 34 give a bounce, with price reclaiming VWAP and testing the $53 highs. Trigger: close above $51.96 on rising volume. Target: $53.00–$54.45 (upper Bollinger Band). Invalidation: close below $49.98. (35% probability)
- Scenario 3: Neutral Chop — Price oscillates between EMA 13 and VWAP ($50–$52) with weak ADX. Trigger: no break of either level. Target: $50.00–$52.00. Invalidation: close outside $49.50–$52.50. (20% probability)
PRICE TARGETS
Timeframe: 4 days. SOXS is a volatile leveraged ETF (ATR about 5%), so I sized the range near the upper end of the interpolated band.
- Target Price: $49.40
- Expected Range: $48.00 to $52.00 (width $4.00, about 7.9% of the current price, between the 2–3 day and 7–10 day guidance)
- Key Levels: Support at $49.98 (EMA 13), then $47.28 (Bollinger midline). Resistance at $51.70 (EMA 34), then $51.96 (VWAP) and $54.45 (upper Bollinger Band).
OVERALL BIAS
OVERALL BIAS: BEARISH - Price is below VWAP and EMA 34 with lower highs, CMF shows persistent distribution (-0.122), and ADX/DI convergence suggests the bounce is losing steam. Offsetting this, the MACD recovery and the rising EMA 13 cap the downside, so conviction is modest, with a target near $49.40.
This is educational analysis and not financial advice.