CRWV 6-day bearish forecast — Nov 15, 2026
- Bias: Bearish
- Timeframe: 6 days (made Nov 15, 2026, target date Nov 20, 2026)
- Price at analysis: $53.11
- Price target: $51.80
- Expected range: $49.80 – $53.90
- Result: Pending — graded after the close on Nov 20, 2026
Get a free AI analysis of CRWV today
Analysis
TECHNICAL INDICATORS
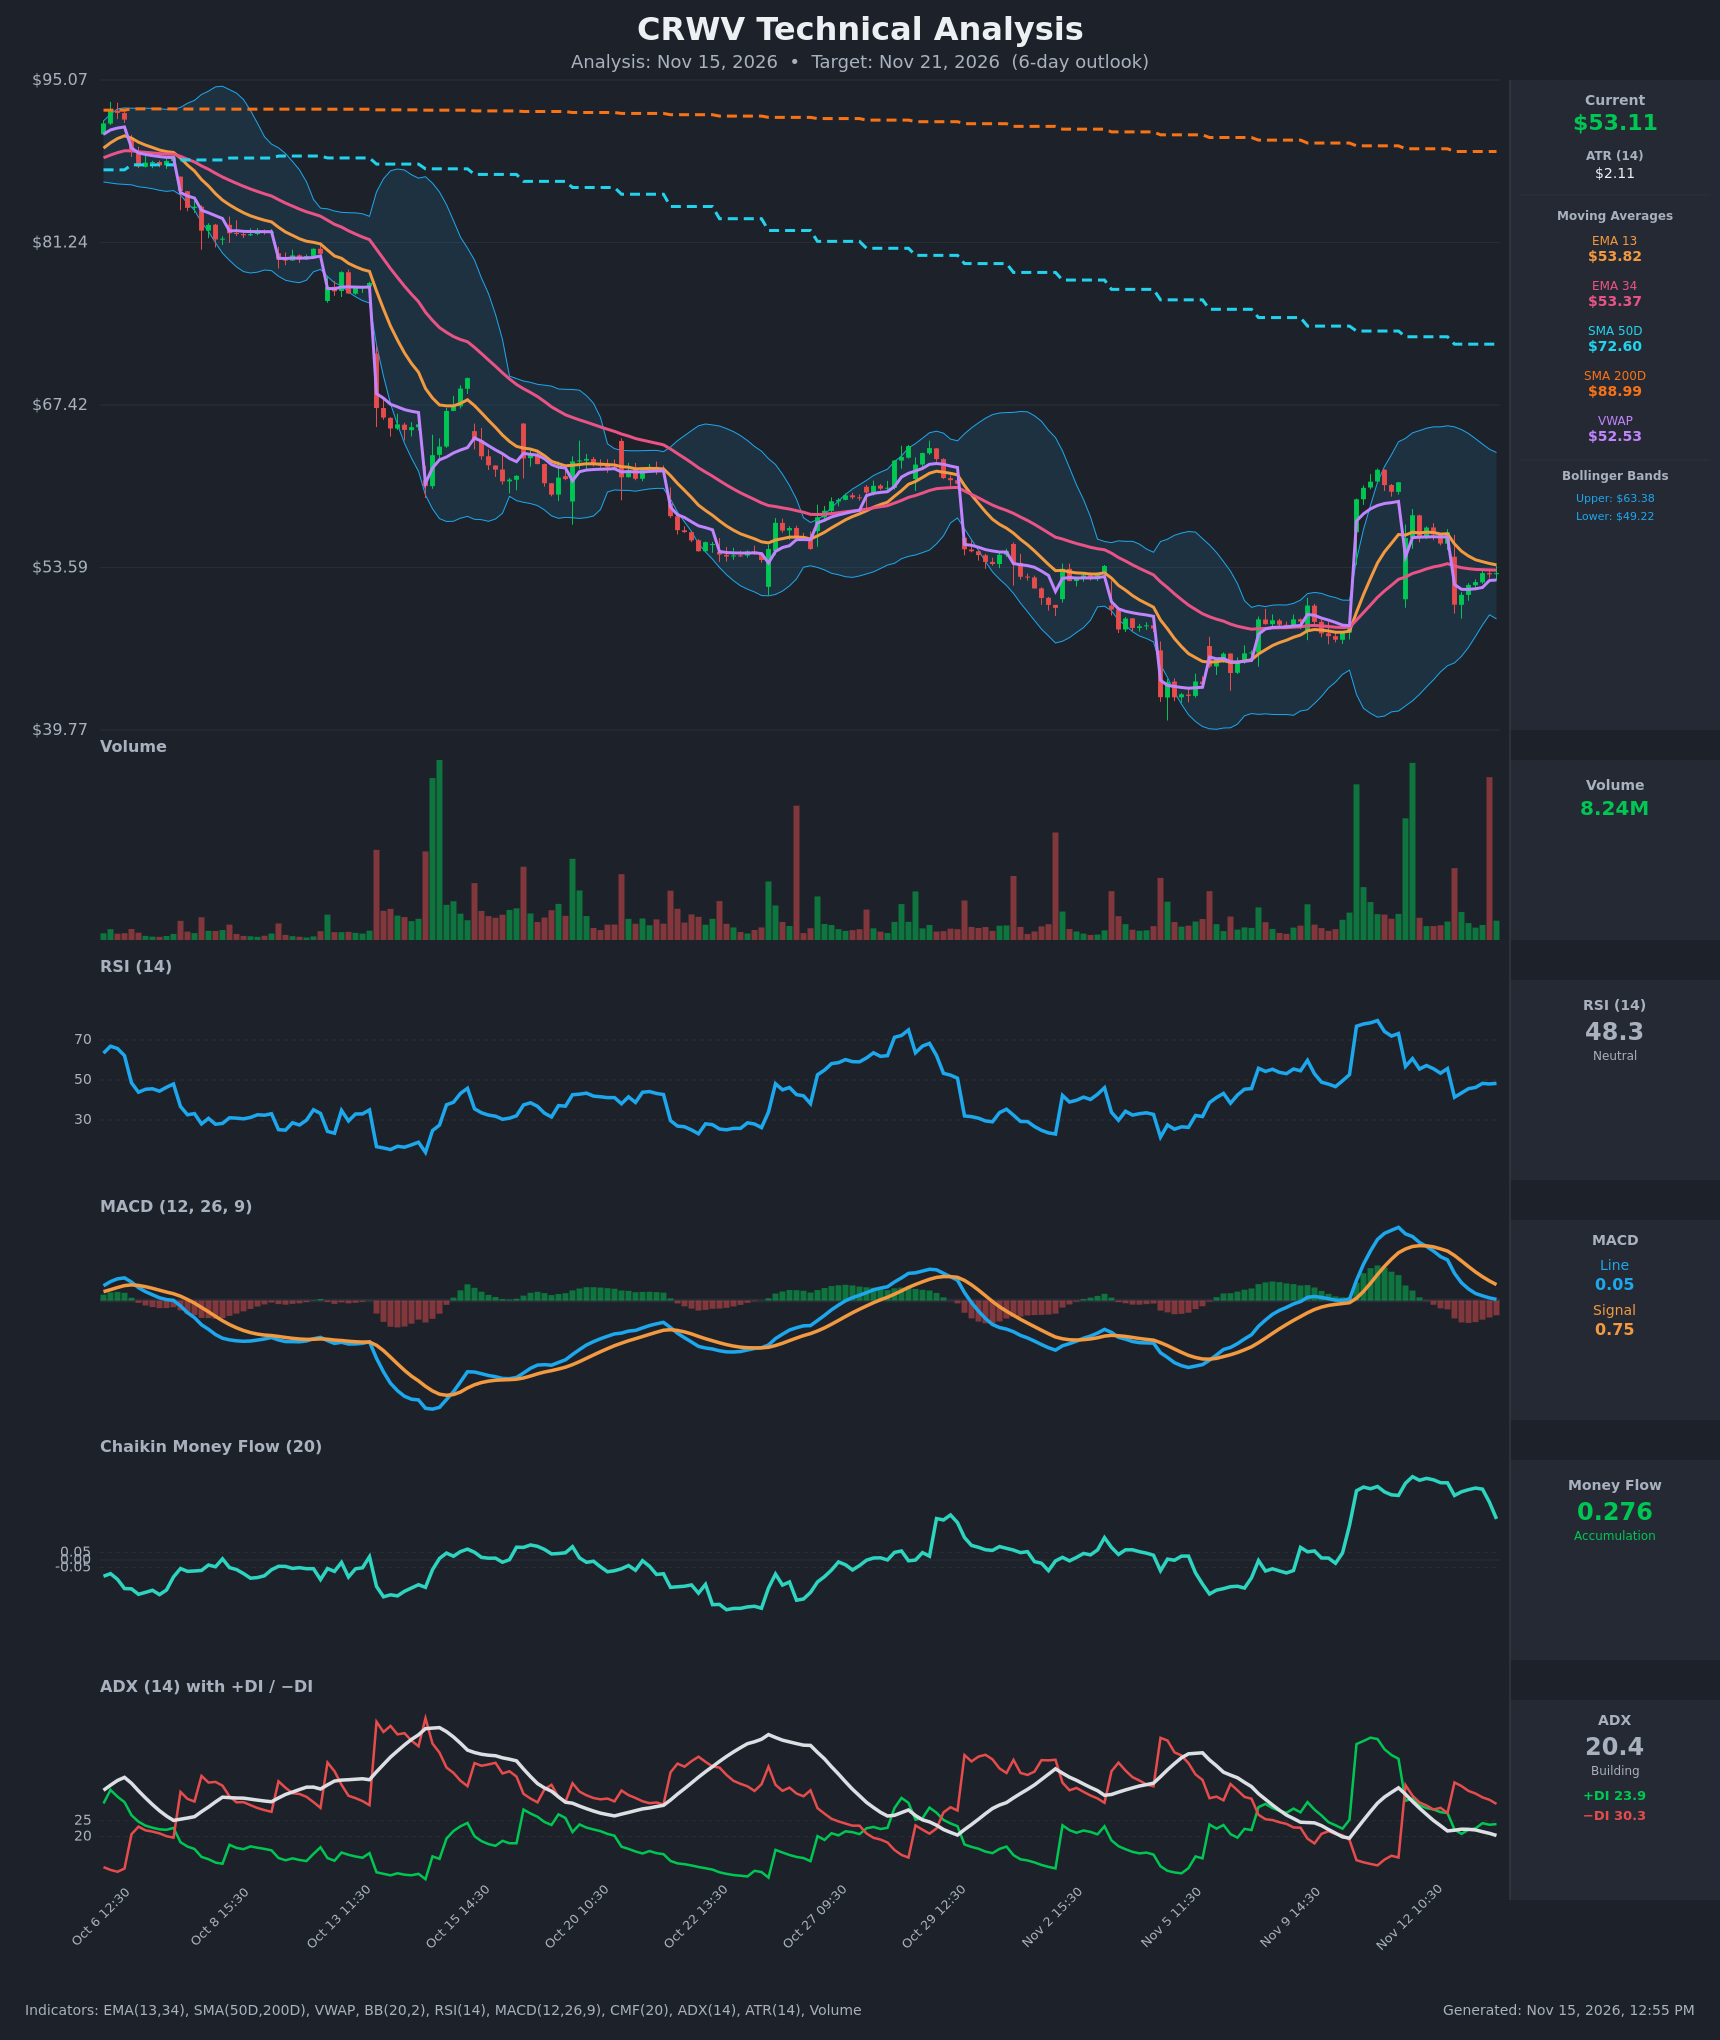
- RSI (14): 48.34, just under the 50 midline. It has dropped from 73 on Nov 11 and bounced from 41.4 on the Nov 13 gap down to the high 40s. Momentum is neutral to slightly weak, with no overbought or oversold signal. [Neutral]
- 20 EMA (13/34 used): EMA 13 is $53.82 and EMA 34 is $53.37. Price ($53.11) is below both. EMA 13 is still above EMA 34 but the gap has narrowed from about $3.8 to $0.45, so a bearish cross is close. The EMAs now act as overhead resistance. [Bearish]
- MACD: Line 0.055, signal 0.747, so the line is below the signal. A bearish crossover occurred around Nov 12 12:30 and the histogram is negative (about -0.69). The line is nearly at zero, so a drop below zero would confirm bearish momentum. The pace of decline is slowing. [Bearish]
- Bollinger Bands (20): Upper $63.38, lower $49.22, with a midline around $56.3. Price sits in the lower half, about 2 points above the lower band. The bands are wide after the volatile spike and gap, which implies large moves are still possible. A failure to reclaim the midline keeps pressure on the lower band. [Bearish]
- CMF (20): +0.276, well above +0.05, which means accumulation. It has faded from a peak of 0.56 on Nov 12 and is falling quickly (0.48 to 0.28 in 3 bars). The reading is bullish but the trend is deteriorating. [Accumulation]
- ADX (14): 20.4 and falling, from 35 on Nov 11, so trend strength is weak and borderline range-bound. −DI (30.3) is above +DI (23.9), so sellers have the edge. [Weak Trend, Bearish lean]
- Volume: 8.24M on the latest bar is modest compared with the huge spikes on the Nov 11 rally and the Nov 13 gap. Selling volume at the gap was heavy, and the rebound has come on lighter volume, so there is little conviction behind the bounce. [Neutral to Bearish]
- Long-term MAs / VWAP: Price is far below SMA50 ($72.60) and SMA200 ($88.99), and SMA50 is well below SMA200 (death cross in force). The long-term trend is firmly down. Price is slightly above VWAP ($52.53), which is a minor support. [Bearish]
DIVERGENCES & TRENDS
- CMF stayed strongly positive while price fell from $60.84 to $53.11. This is a mild bullish divergence, but CMF is now rolling over and the divergence is fading.
- RSI made a lower high (73 to 56 to 48) alongside lower price highs after the spike. This is bearish momentum confirmation, not a divergence.
- MACD crossed below its signal line on Nov 12, and the histogram has been negative since. EMA 13 is converging toward EMA 34 and is close to a bearish cross.
- ADX has fallen from 35 to 20, so the trend is fading. The Nov 11 spike rally has been largely retraced, with price now back near the pre-rally $50-53 zone.
- On the daily-scale chart, the major trend is a long series of lower highs and lower lows from about $92 down to about $40. The Nov 5 low near $40-42 was followed by a bounce, and the market is still a rally within a downtrend.
CHART PATTERNS
- The closest reference pattern is a Bearish Flag/Pennant (continuation). After the sharp drop from $56.59 to $50.43 on Nov 13, price has been drifting up in a small, low-conviction channel from $50.43 to $53.11. A break below about $50.4 would project a measured move toward the mid-$40s. This is a loose fit and not a clean pattern.
- The wider structure is a descending channel of lower highs since October, with a sharp spike that failed. This supports a continuation bias.
- The alternative is a Bullish Double Bottom / base around $40-42 and $50. It would only be confirmed by a reclaim above $56.6-$57, which has not happened.
POTENTIAL SCENARIOS
- Scenario 1: Bearish Continuation Lower — Price fails at the EMA 13/34 and VWAP area, EMA 13 crosses below EMA 34, and MACD heads below zero as −DI stays on top. Sellers push toward the gap low and the lower Bollinger Band. Trigger: hourly close below $52.50 (VWAP). Target: $50.40, then $49.20. Invalidation: close above $54.80. (50% probability)
- Scenario 2: Neutral Range Chop — ADX is below 20 and price oscillates around the converged EMAs and VWAP between the gap low and the gap origin. Trigger: no break of $50.40 or $54.50. Target: $51.50 to $53.50. Invalidation: break of either boundary. (25% probability)
- Scenario 3: Bullish Relief Bounce — Strong CMF accumulation drives a rebound above the EMAs, filling part of the Nov 13 gap. Trigger: close above $54.50 on rising volume. Target: $56.50 (gap origin). Invalidation: drop back below $52.50. (25% probability)
PRICE TARGETS
- Target Price: $51.80 (6-day horizon, about -2.5%)
- Expected Range: $49.80 to $53.90 (width $4.10, about 7.7% of the current price, appropriate for a 6-day window)
- Key Levels: Support at $50.43 (Nov 13 gap low; lower Bollinger Band at $49.22 below it), Resistance at $53.82 (EMA 13, then $56.59 gap origin)
OVERALL BIAS
OVERALL BIAS: BEARISH - Price is below the EMAs and far below the SMA50/SMA200 (death cross), MACD is below its signal, −DI leads +DI, and the bounce is on light volume. Strong but fading CMF accumulation and a weak ADX keep conviction modest.
This is educational analysis and not financial advice.