CRWV 4-day bearish forecast — Nov 15, 2026
- Bias: Bearish
- Timeframe: 4 days (made Nov 15, 2026, target date Nov 18, 2026)
- Price at analysis: $53.11
- Price target: $51.60
- Expected range: $50.00 – $54.20
- Result: Pending — graded after the close on Nov 18, 2026
Get a free AI analysis of CRWV today
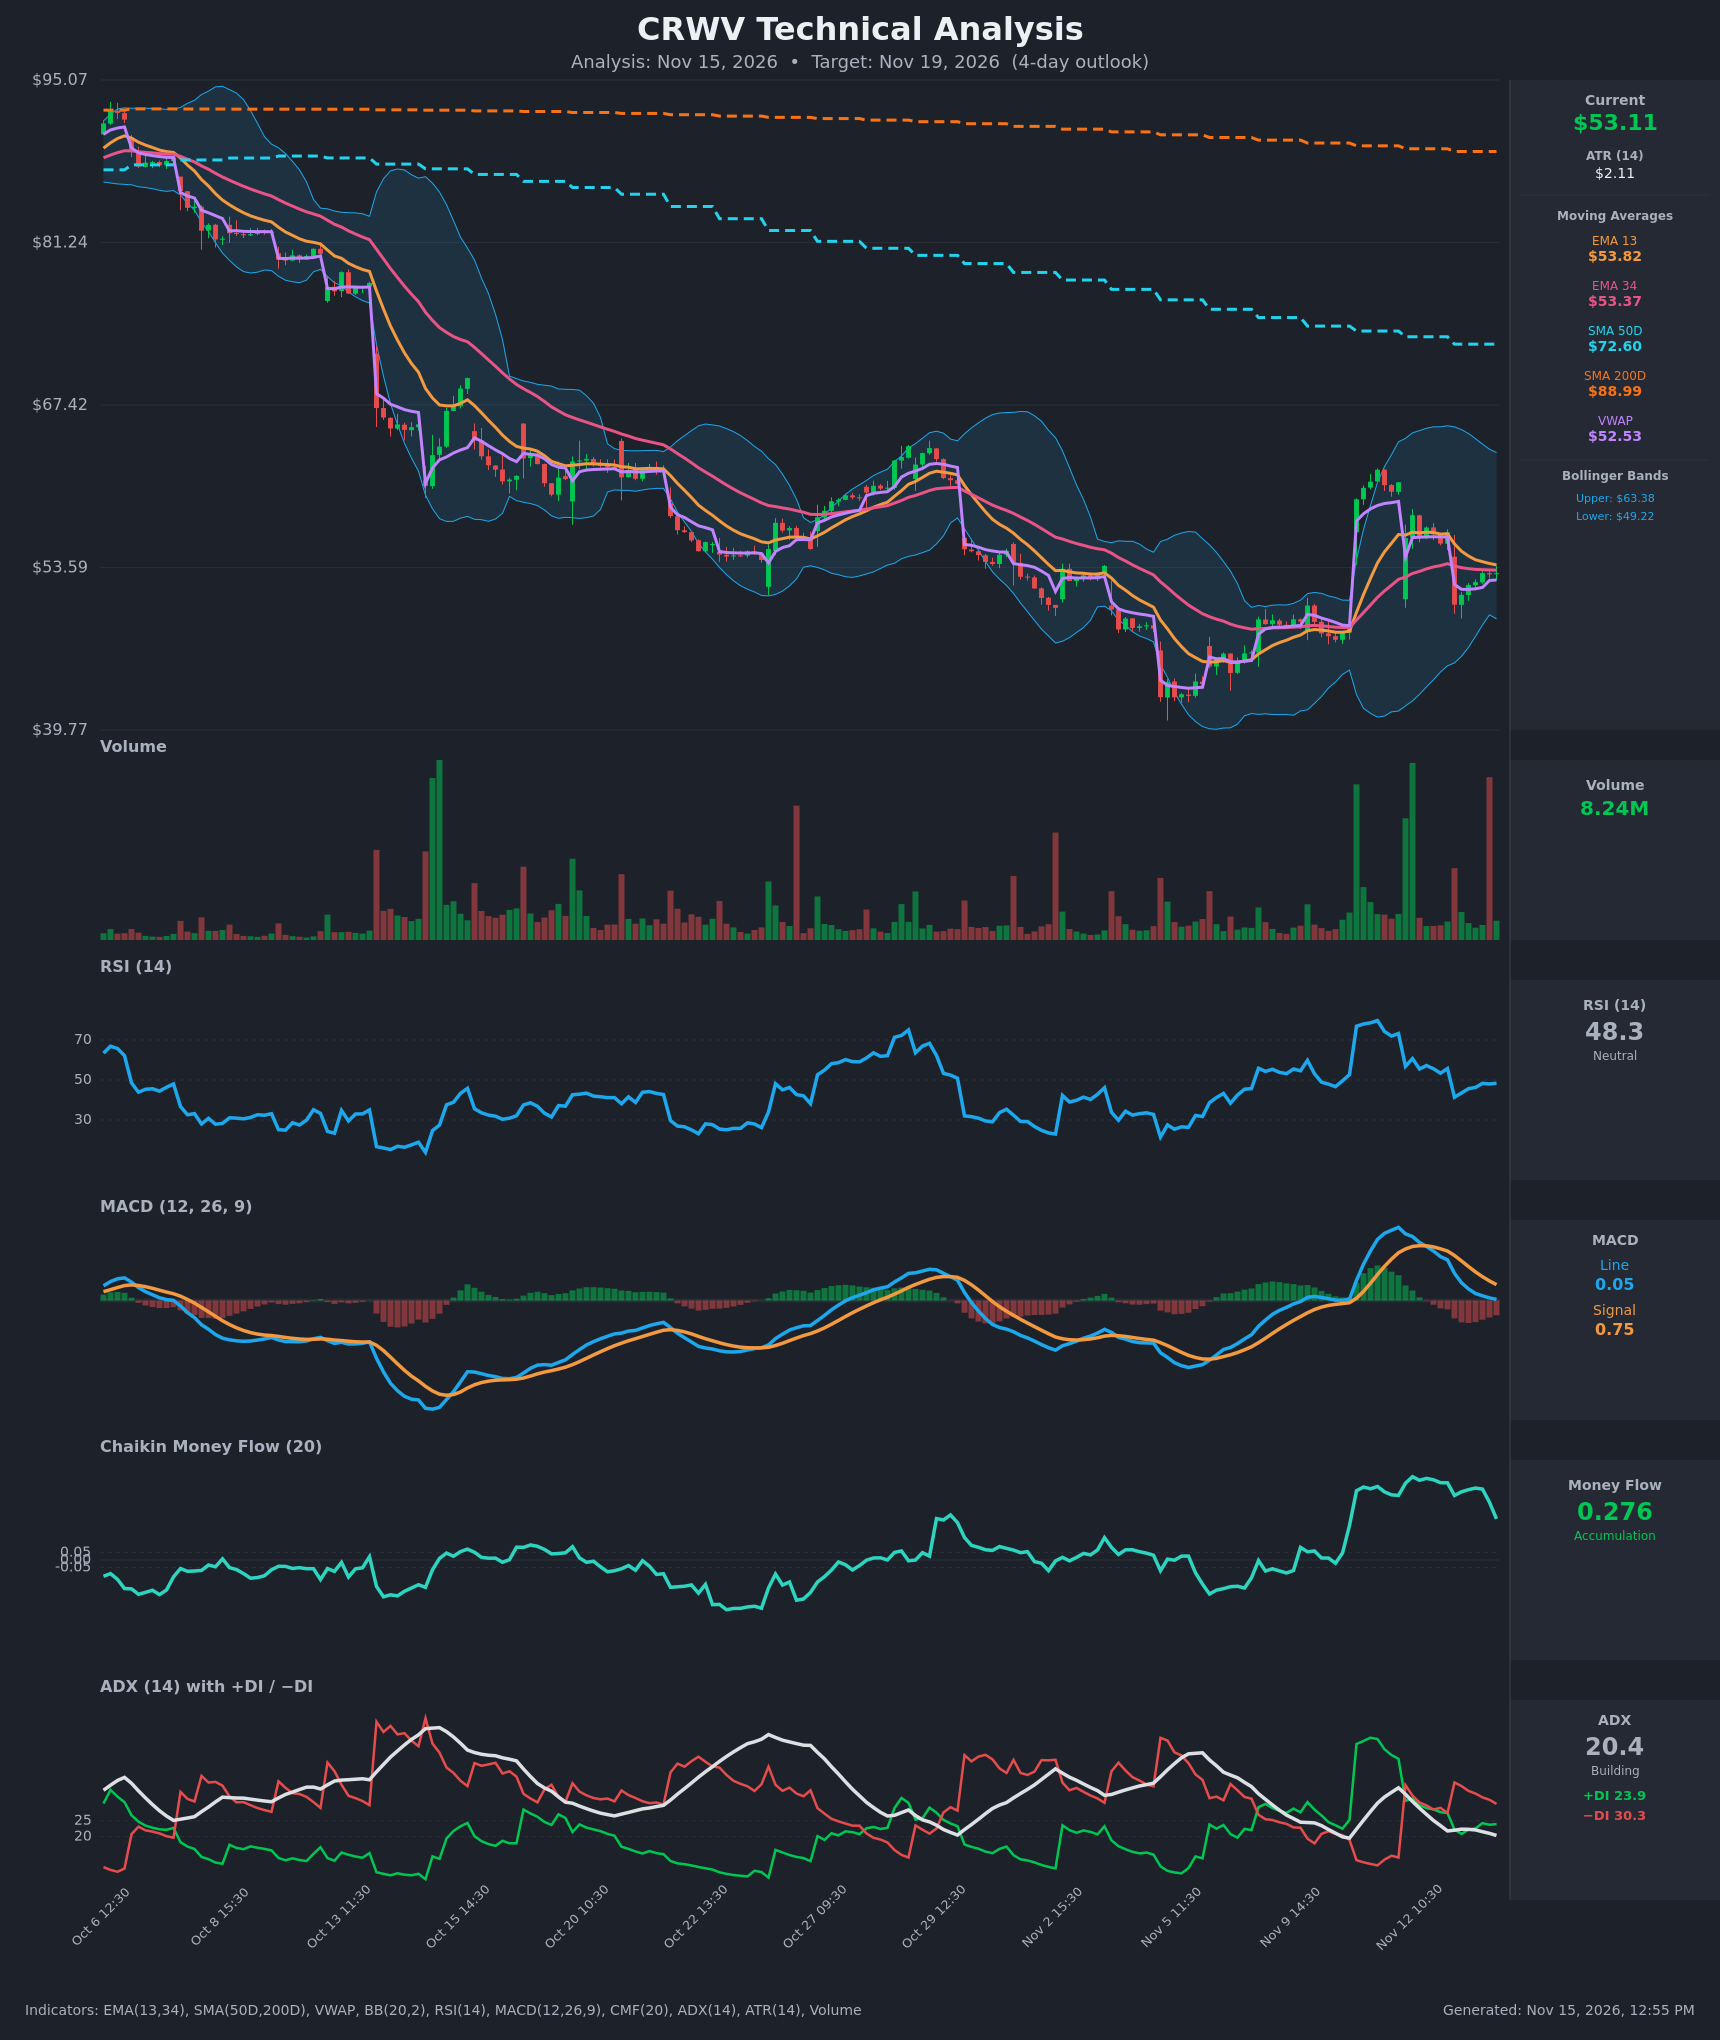
Analysis
TECHNICAL INDICATORS
- RSI (14): 48.34, neutral. It has fallen from 73 on Nov 11 to the 40s and is now flat around 48. It is stuck below the 50 midline after the failed spike, so momentum is fading rather than recovering. [Neutral]
- 20 EMA (EMA 13/34 shown): EMA 13 is $53.82 and EMA 34 is $53.37. Price at $53.11 sits just below both, so the EMAs act as overhead resistance. EMA 13 is still above EMA 34, but the gap has narrowed from about $3.8 to $0.45 and a bearish cross looks likely. [Bearish]
- MACD: Line 0.055, signal 0.747, histogram negative at about -0.69. The line crossed below the signal on Nov 12 and the gap is only slowly narrowing. The line is nearly at zero, so a drop below it would confirm further weakness. [Bearish]
- Bollinger Bands (20): Upper $63.38, lower $49.22, midline roughly $56.3. Price is in the lower half of the bands, well below the midline, and the bands are still wide after the gap spike. The lower band at $49.22 is a downside magnet. A reclaim of the midline would be needed to turn this bullish. [Bearish]
- CMF (20): 0.276, well above +0.05, but it has dropped from 0.56 to 0.28 over the last few sessions. Accumulation persists, though it is clearly waning and the drop in the last bars shows buying pressure thinning. [Accumulation]
- ADX (14): 20.4 and falling (from 35), so the trend is weak and borderline range-bound. −DI (30.3) is above +DI (23.9), so bears have the edge, though without much trend strength. [Weak Trend, Bearish lean]
- Volume: 8.24M on the latest bar, which is moderate and below the big spike bars from the gap-up and the Nov 13 selloff. The bounce from $50.43 to $53.11 came on fading volume, which makes it a weak recovery. [Neutral to Bearish]
Other context:
- VWAP: $52.53, just below price. This is a small support and a mildly bullish intraday point.
- SMA 50D / 200D: $72.60 and $88.99. Price is far below both, which is a confirmed long-term downtrend with the 50D under the 200D (death-cross configuration).
DIVERGENCES & TRENDS
- CMF vs. price: CMF is high (0.28) while price has fallen from $60.84 to $53.11. This is a mild bullish divergence, but CMF is rolling over sharply, so it is weakening.
- MACD and RSI: Both made lower highs after the spike, with MACD down from 3.4 to 0.05 and RSI down from 73 to 48. Momentum has decayed in line with price.
- ADX: It has fallen from 35 to 20 while −DI crossed above +DI on Nov 12-13, so the short-term upswing has lost its trend strength.
- EMA 13 vs. EMA 34: They are converging with a bearish cross imminent. Price is below EMA 13 and just above EMA 34.
- Larger trend: The series of lower highs ($93 to $63 to $60.8) and the position below the declining SMA 50D and 200D keep the primary trend down.
CHART PATTERNS
- Bearish Flag / Pennant (continuation): After the sharp drop from $60.84 to $50.43, price has been making a small, tight bounce between roughly $50.4 and $53.8. This resembles a bearish flag or pennant. A break below $50.40 projects roughly a measured move of about $3-4 toward $47-$49, near the lower Bollinger Band at $49.22.
- Earlier base: The low near $40 followed by the large rally looks like a possible double-bottom reversal at the multi-month lows. The reversal is only partly confirmed, because price is failing to hold the gap-up gains.
- Bullish counter-pattern: A reclaim of $55.6-$56.3 on volume would negate the flag and aim at the $60-$61 spike high.
POTENTIAL SCENARIOS
- Scenario 1: Bearish Flag Breakdown — Price fails at the EMA 13/34 resistance zone, the MACD line goes negative, and −DI stays dominant, pushing price below the Nov 13 low. Trigger: close below $50.40 or a bearish EMA 13/34 cross. Target: $49.20 (lower BB), then $47.50. Invalidation: close above $55.60. (50% probability)
- Scenario 2: Bullish Reclaim and Recovery — CMF accumulation and the VWAP hold lead to a push through the EMAs and a retest of the Bollinger midline. Trigger: close above $53.82 followed by $55.60 on rising volume. Target: $56.30 (BB midline), then $58. Invalidation: close below $52.50 (VWAP), then $50.40. (30% probability)
- Scenario 3: Neutral Chop — Price stays between VWAP and the EMAs while ADX stays near 20. Trigger: failure to break either $50.40 or $55.60. Target: $52-$54. Invalidation: close outside the $50.40-$55.60 range. (20% probability)
PRICE TARGETS
- Target Price: $51.60 (4-day horizon)
- Expected Range: $50.00 to $54.20 (width about $4.20, or roughly 7.9% of price, which is scaled between the 2-3 day and 7-10 day guidance, consistent with this stock's volatility)
- Key Levels: Support at $50.40, Resistance at $53.82
OVERALL BIAS
OVERALL BIAS: BEARISH - Price is below the EMAs and far below the declining SMA 50D/200D, MACD is under its signal line, and −DI leads +DI. The bounce is a low-volume flag under resistance. The still-positive but falling CMF and the VWAP hold limit conviction, so the expected move is modest.
This is educational analysis and not financial advice.