HOOD 113-day bearish forecast — Nov 15, 2026
- Bias: Bearish
- Timeframe: 113 days (made Nov 15, 2026, target date Mar 8, 2027)
- Price at analysis: $77.86
- Price target: $71.00
- Expected range: $61.00 – $82.00
- Result: Pending — graded after the close on Mar 8, 2027
Get a free AI analysis of HOOD today
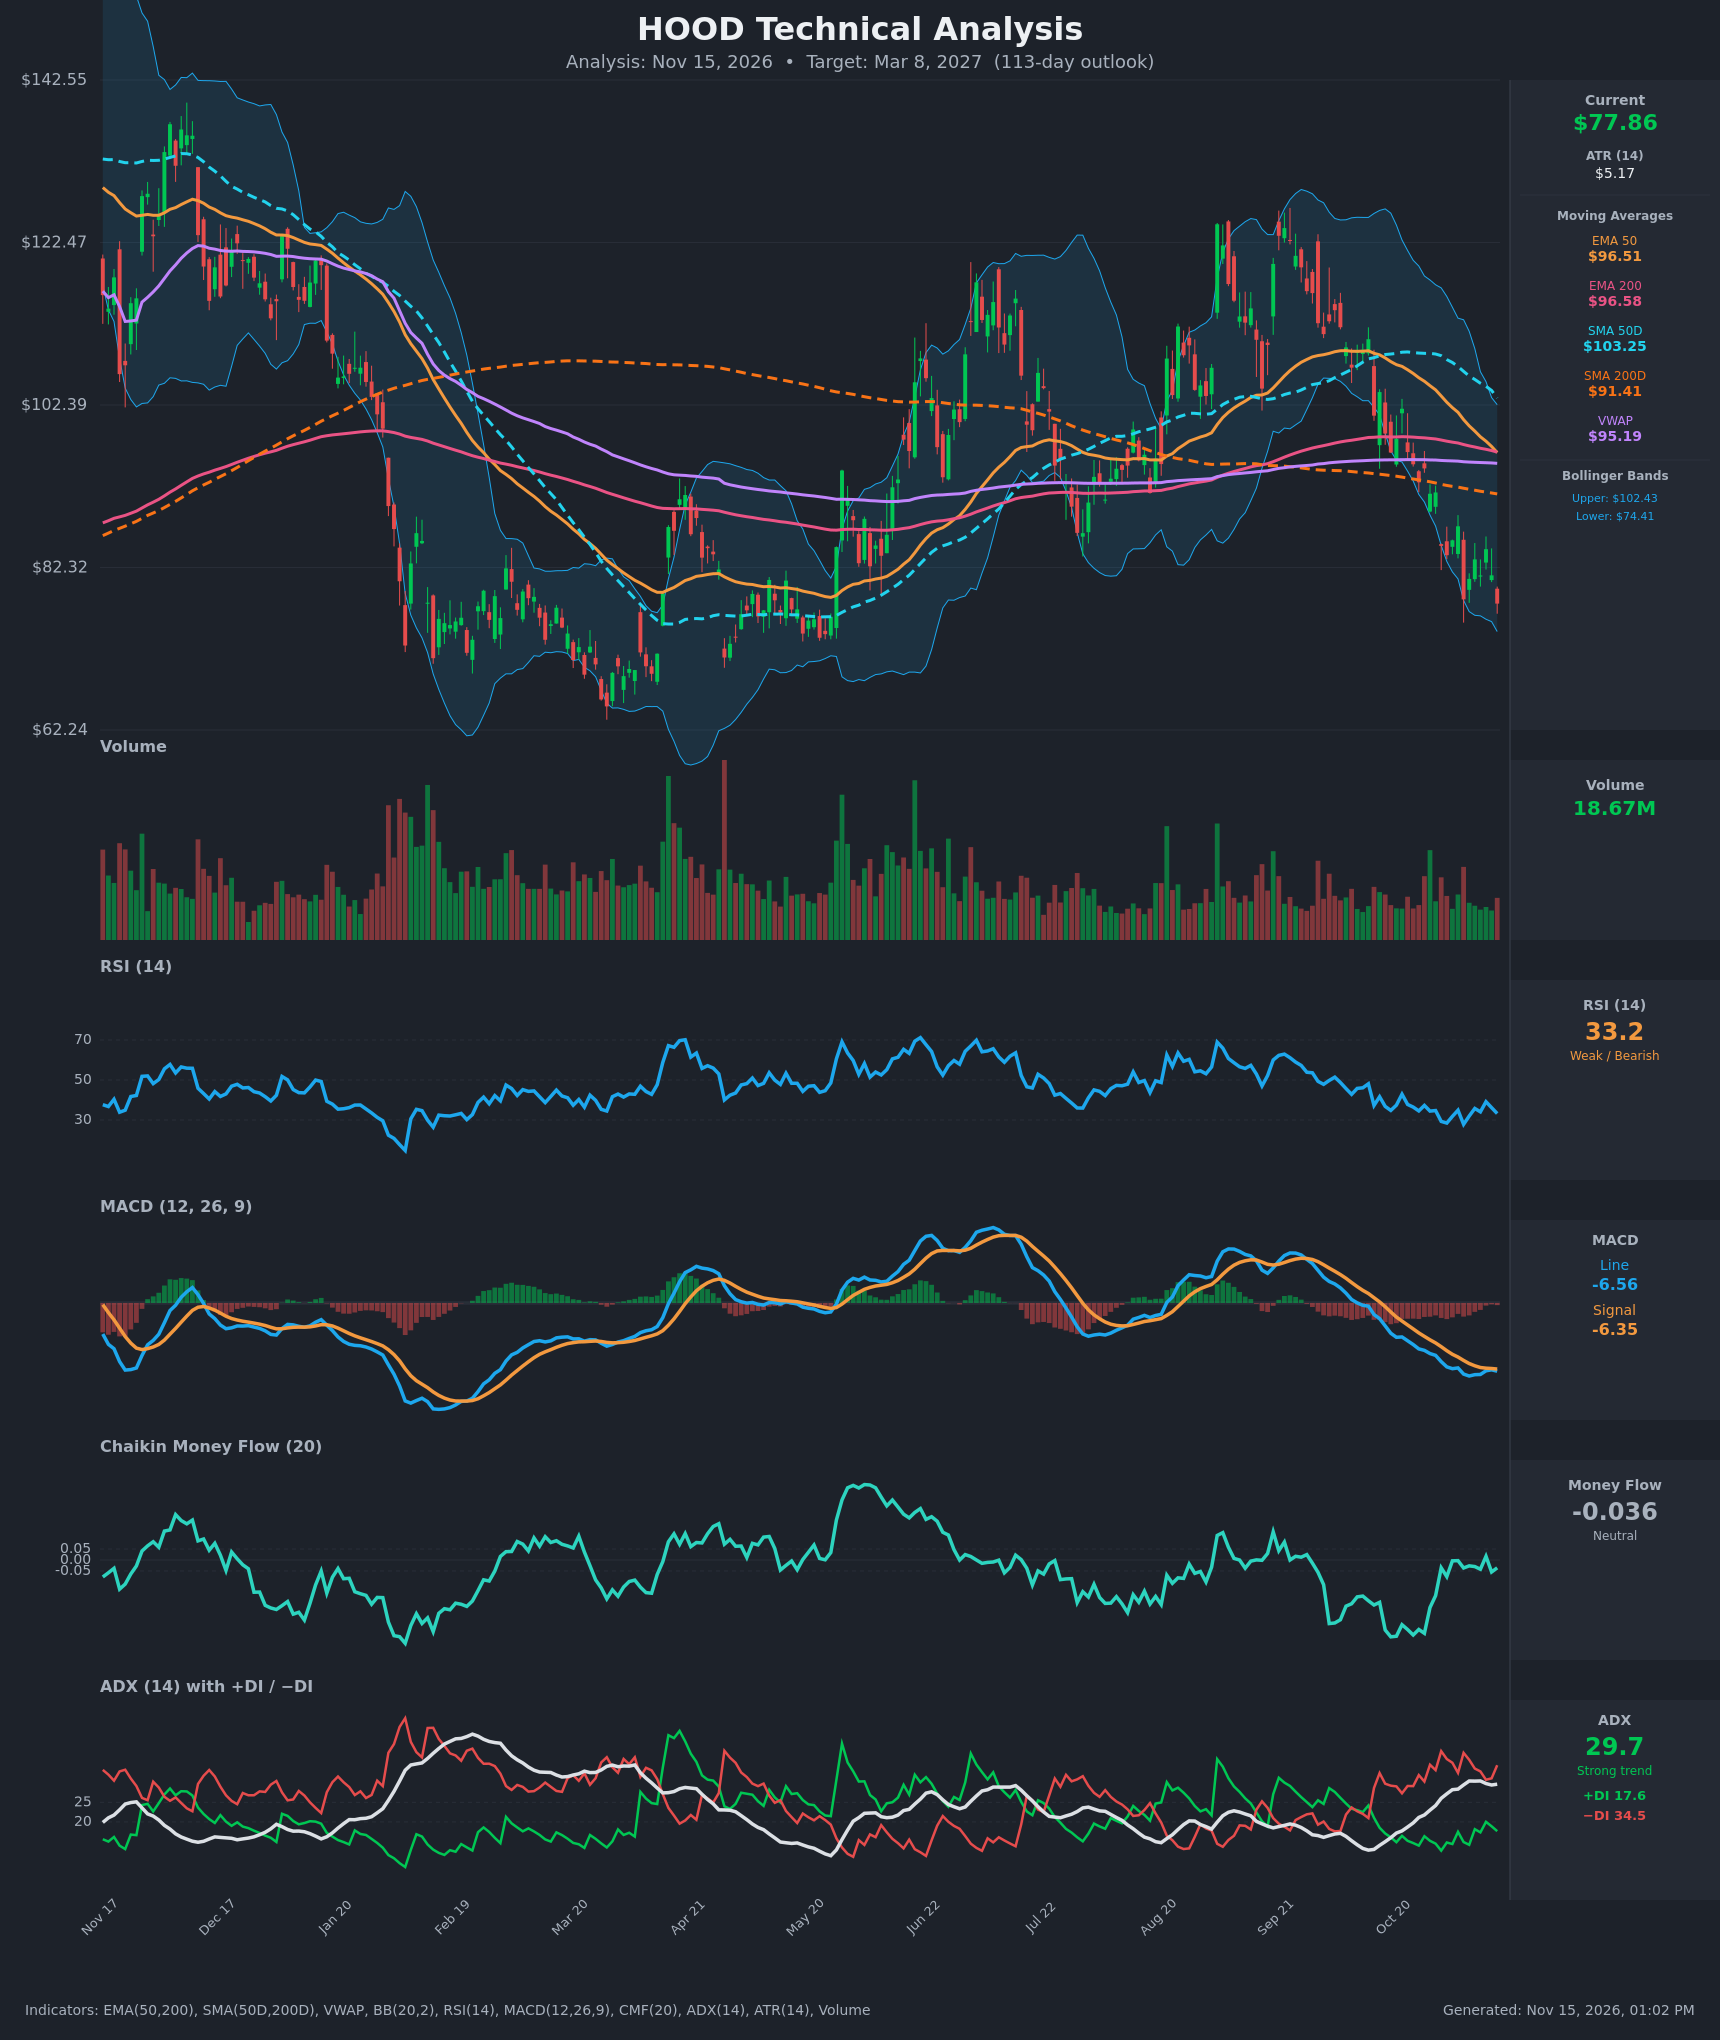
Analysis
TECHNICAL INDICATORS
- RSI (14): 33.23, just above the oversold line. It has stayed in the 28-39 range for about two weeks, and every bounce has faded below 40. Price made a marginally lower low (77.86 vs 78.39) while RSI is above its 27.8 low, which is a mild bullish divergence, but momentum is still weak. [Bearish]
- 20 EMA: Not supplied. Price at $77.86 is below the EMA50 ($96.51), EMA200 ($96.58), VWAP ($95.19) and SMA50D ($103.25), so the short-term average, if plotted, would sit well above price and act as resistance. EMA50 has just slipped below EMA200 ($96.51 vs $96.58), a fresh bearish EMA cross. [Bearish]
- MACD: Line -6.56 is below signal -6.35, with a slightly negative histogram. Both lines are deeply negative and near their lows, and the line has been below the signal for the whole decline. The histogram is shrinking, so downside momentum is stalling, but there is no bullish crossover. [Bearish]
- Bollinger Bands (20): Upper $102.43, lower $74.41. Price is in the bottom 12% of the band, about $3.45 above the lower band, after repeated "band-walk" action. The bands are wide and sloping down, which fits a trend rather than a squeeze. A close below $74.41 would signal continuation. [Bearish]
- CMF (20): -0.036, between ±0.05, so neutral. It has recovered from about -0.33 in late October. Selling pressure has eased, but there is no accumulation yet. [Neutral]
- ADX (14): 29.7 and rising from 21 in late October, so the trend is strong. -DI at 34.5 is far above +DI at 17.6, so bears are firmly in control. [Strong Trend – Bearish]
- Volume: 18.67M, about average to slightly below, with no capitulation spike. The selloff from the Sep/Oct highs has come without a volume climax, so a durable bottom is not yet confirmed. [Neutral to mildly Bearish]
DIVERGENCES & TRENDS
- Mild bullish divergence: price made a marginally lower low on Nov 13 ($77.86 vs $78.39 on Nov 5), while RSI (33.2 vs 27.8) and MACD (-6.56 vs -7.02) are higher. This is early and unconfirmed.
- Trend alignment is bearish. Price is below EMA50, EMA200, SMA200D ($91.41) and VWAP. SMA50D ($103.25) is falling quickly toward SMA200D ($91.41), and a death cross is plausible within weeks if the decline continues.
- EMA50 just crossed below EMA200 (96.51 vs 96.58).
- ADX has risen from 21 to ~30 with −DI dominant, so the trend is strengthening, not exhausting.
- CMF has improved from -0.33 to -0.04, so selling pressure is easing, but this is not yet a reversal signal.
- The stock has dropped about 40% from its Sep high near $128. The $62-70 zone (Feb/Mar lows) is the major long-term support area.
CHART PATTERNS
- Bearish Double Top (reference diagram): The Jun ($122) and Sep ($128) highs form a rough double top, with a neckline near $82-85 (the Jul/Aug lows). Price has broken through that neckline. The measured move (~$43) implies a theoretical objective in the $40s, but that would be extreme given the major support at $62-70. A more realistic target is a retest of the $65-70 base.
- Price action since September also looks like a downward channel of lower highs and lower lows, which is a bearish continuation structure.
- A bullish falling wedge or double bottom would need a base to form near $65-75 with a break above ~$88. That is not visible yet.
POTENTIAL SCENARIOS
- Scenario 1: Bearish Trend Continuation to the Prior Base — Price stays below the falling EMA50/EMA200 and VWAP, with -DI dominant and the double top neckline break as resistance. Selling leads to a test of the $65-72 area, with a possible overshoot toward $60. Trigger: daily close below $74.41 (lower BB) with MACD staying below its signal. Target: $68-72, extending to $62-65. Invalidation: daily close above $88 (reclaiming the Nov 4 close and neckline area) with a MACD bullish cross. (50% probability)
- Scenario 2: Bullish Oversold Reversal / Base Formation — The RSI/MACD divergence resolves upward, CMF turns positive, and price bounces toward the moving-average cluster. Trigger: close above $88 with RSI above 50 and CMF above +0.05. Target: $92-96 (SMA200D, EMA50/EMA200 and VWAP cluster). Invalidation: close below $70. (30% probability)
- Scenario 3: Neutral Basing Range — Price chops between about $68 and $88 as selling exhausts, without a clear breakout. Trigger: ADX falls below 20 with price holding the $70-85 area. Target: $75-82. Invalidation: close outside the $66-90 range. (20% probability)
PRICE TARGETS
- Target Price: $71.00 (113-day horizon, Mar 8, 2027)
- Expected Range: $61.00 to $82.00 (width $21.00, about 27% of the current price, consistent with the 61-180 day guidance)
- Key Levels: Support at $74.41 (lower Bollinger Band; deeper support at $65-68), Resistance at $87.40 (Nov 4 close / neckline area; major resistance at the $95-97 moving-average cluster)
OVERALL BIAS
OVERALL BIAS: BEARISH - Price is below every major moving average, −DI (34.5) dominates +DI (17.6) with ADX near 30, MACD is below its signal, and EMA50 has just crossed below EMA200. The oversold RSI and mild divergence argue for a bounce, but there is no confirmed reversal. The base case is a drift toward the $65-72 support zone.
This is educational analysis and not financial advice.