AAL 4-day bearish forecast — Nov 15, 2026
- Bias: Bearish
- Timeframe: 4 days (made Nov 15, 2026, target date Nov 18, 2026)
- Price at analysis: $13.16
- Price target: $12.98
- Expected range: $12.55 – $13.47
- Result: Pending — graded after the close on Nov 18, 2026
Get a free AI analysis of AAL today
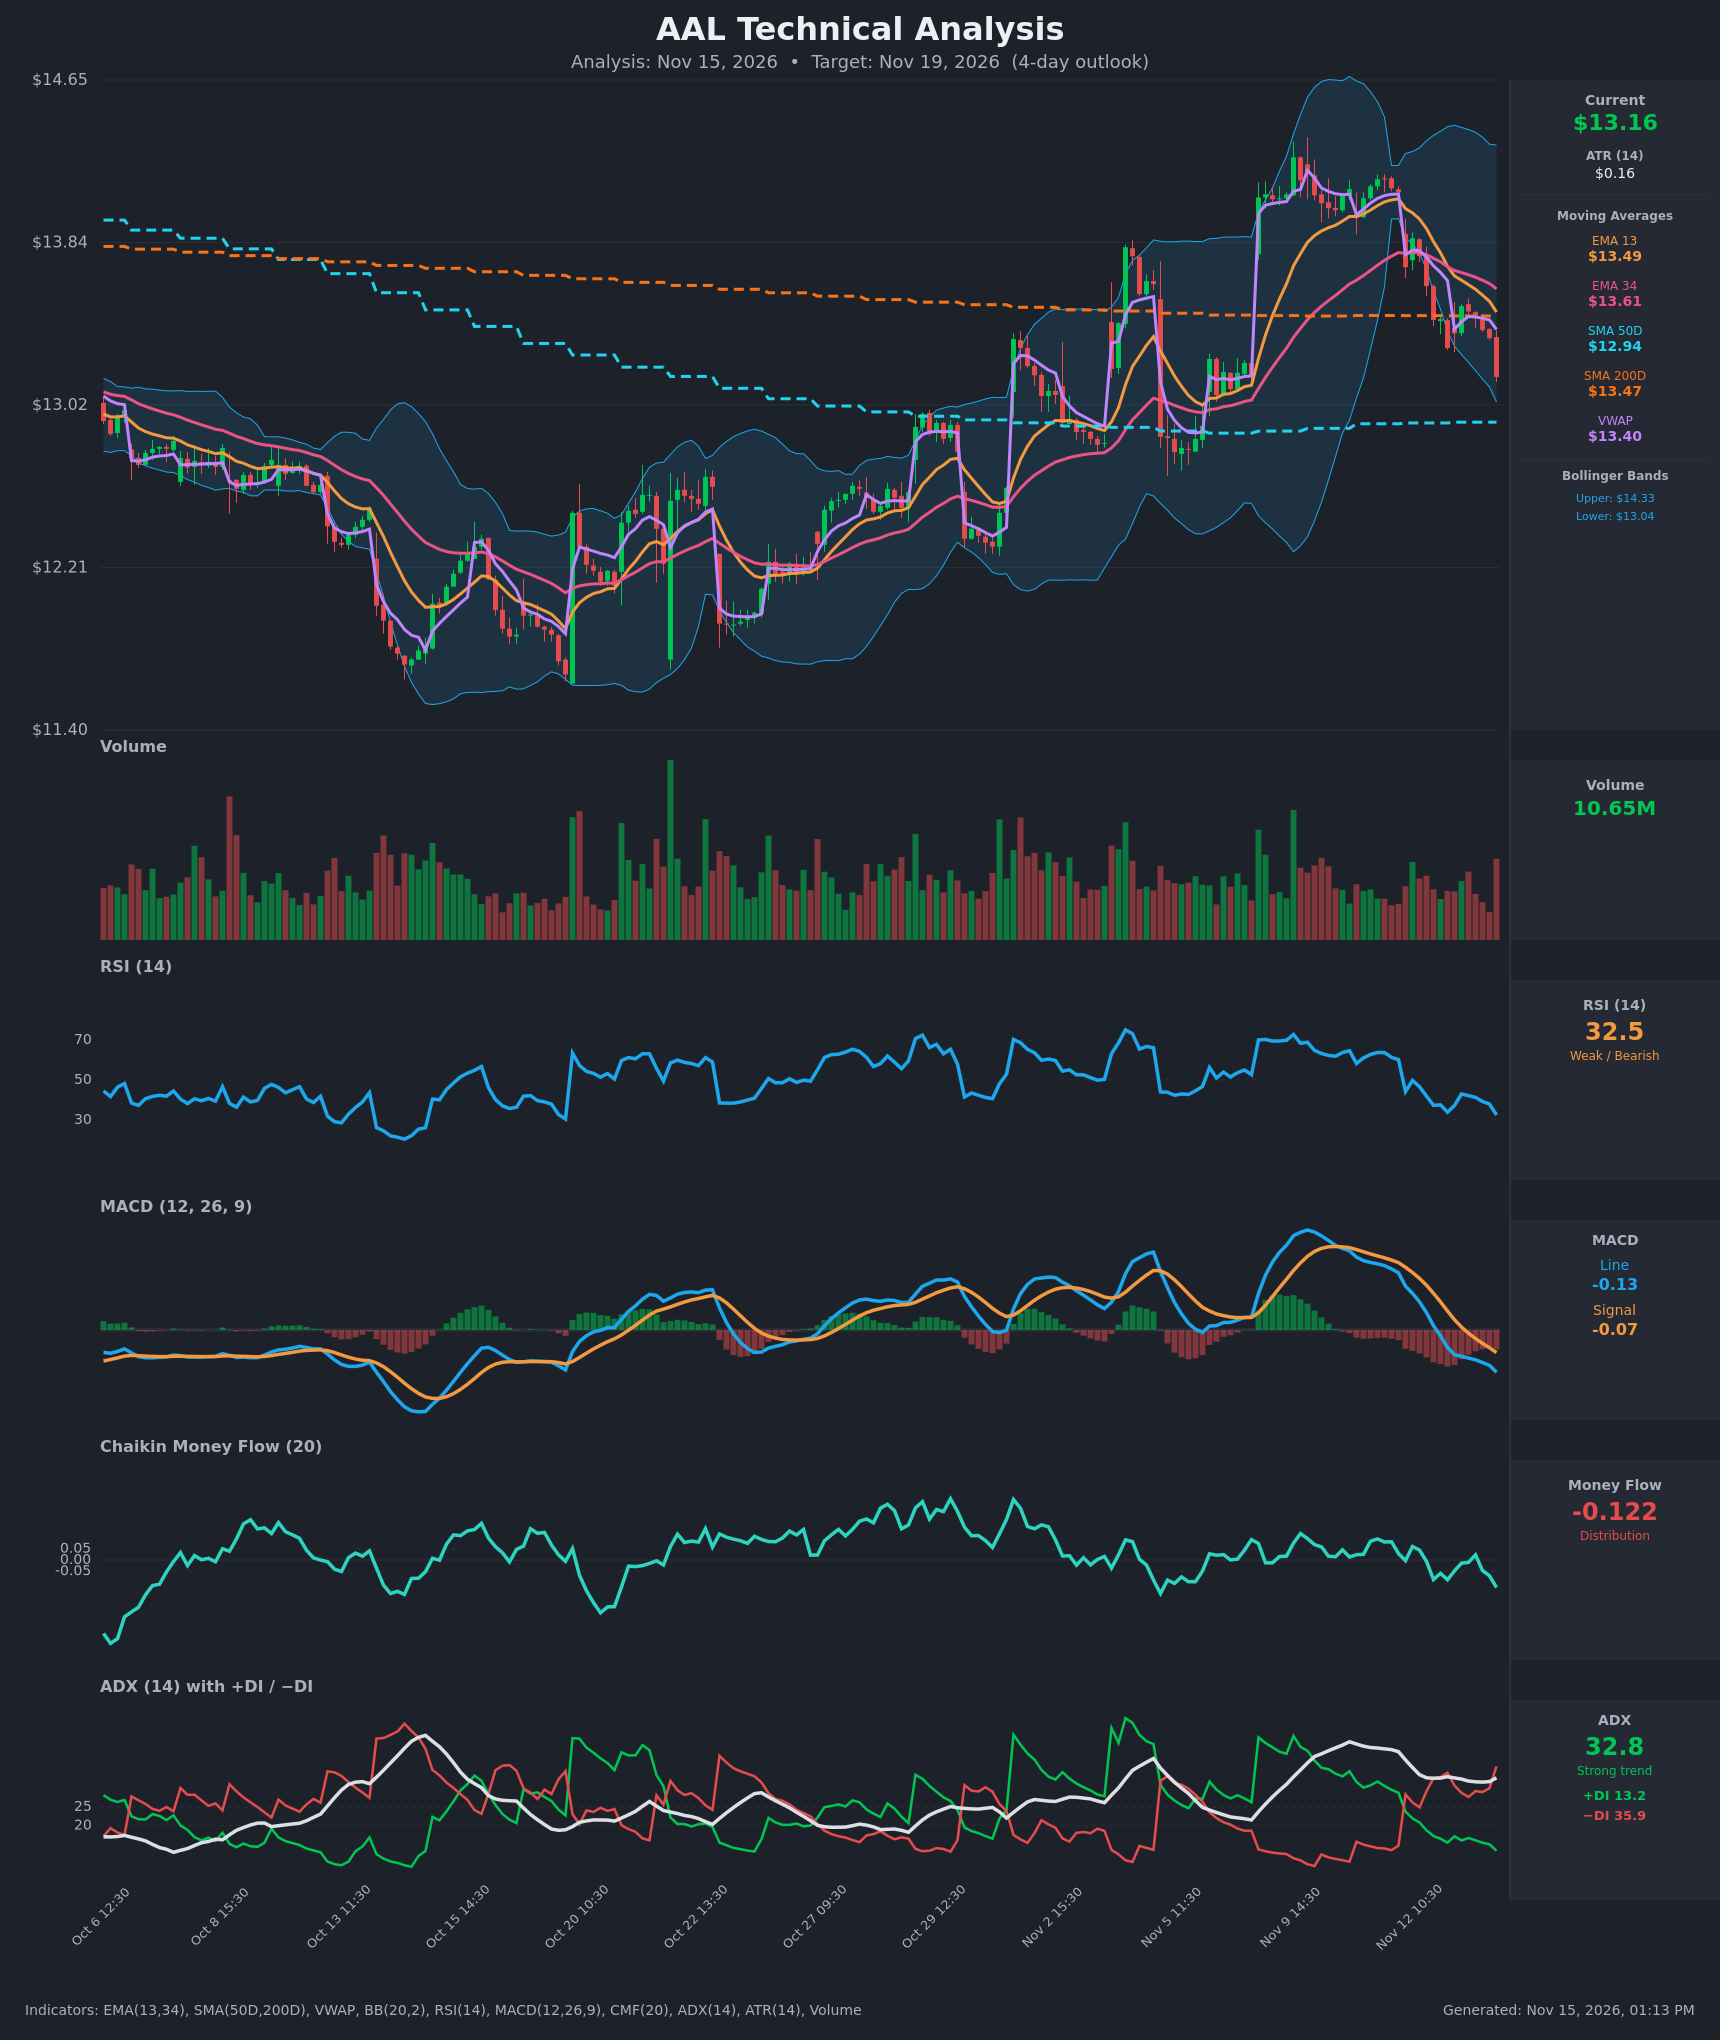
Analysis
TECHNICAL INDICATORS
- RSI (14): 32.53, falling steadily from 60 on Nov 11 and now close to oversold (<30). Momentum is clearly down, though a bounce becomes more likely as it nears 30. [Bearish]
- 20 EMA: The chart provides EMA 13 ($13.49) and EMA 34 ($13.61). Price at $13.165 is below both, and both are sloping down. EMA13 is below EMA34 (bearish cross occurred around Nov 12 15:30), so the EMAs act as overhead resistance. [Bearish]
- MACD: The line is -0.1295, below the signal at -0.0696. It crossed below the signal around Nov 12 14:30, and the histogram is negative and widening. This is accelerating bearish momentum. [Bearish]
- Bollinger Bands (20): Upper $14.33, lower $13.04. Price at $13.165 is hugging the lower band, only about $0.13 above it. The bands are wide after the earlier rally. A walk along the lower band is possible in a strong trend, but a mean-reversion bounce is also possible. [Bearish]
- CMF (20): -0.122, below the -0.05 threshold and falling from slightly positive readings. This shows growing distribution and selling pressure. [Distribution]
- ADX (14): 32.8, above 25, so the trend is strong. −DI at 35.9 is far above +DI at 13.2, so bears are firmly in control. [Strong Trend – Bearish]
- Volume: 10.65M on the last bar, with the most recent bars red on average-to-slightly-higher volume. The final selling bar is a large red candle. There is no capitulation spike yet. [Bearish – selling pressure, no exhaustion]
DIVERGENCES & TRENDS
- There is no bullish RSI divergence yet. RSI is making lower lows alongside price.
- MACD, RSI, CMF and DI are all rolling over together, so the indicators confirm the price move.
- Price has broken below EMA13 and EMA34 and below VWAP ($13.40). It also sits below SMA200D ($13.47), having lost the 200-day average.
- The EMA13/EMA34 bearish cross and the MACD bearish cross have both occurred. The −DI/+DI cross happened Nov 12.
- SMA50D at $12.94 is the next major support, about 1.7% below price. SMA50D is still below SMA200D, so there is no golden cross.
- The 5-day drop from about $14.09 to $13.16 is a sharp reversal off the peak near $14.1.
CHART PATTERNS
- The rally from the early-November base to about $14.1 followed by a lower-high sequence resembles a Bearish Double Top / failed breakout. The reversal is confirmed by the loss of the EMAs and SMA200D.
- The recent sequence of lower highs and lower lows, with a slight upward-slanting recovery from $13.31 to $13.52, looks like a Bearish Flag or small bounce within a downtrend. The measured target extends toward the SMA50D at $12.94 and possibly the $12.7–12.8 area.
- Price near the lower Bollinger Band limits the downside speed in the short term, and a pause or bounce toward $13.35–13.45 is plausible.
POTENTIAL SCENARIOS
- Scenario 1: Bearish Continuation Toward SMA50D — Price stays below the EMAs, VWAP and SMA200D, with strong −DI dominance and a negative MACD, and drifts down toward the 50-day average. Trigger: break below the $13.04 lower band / $13.10 intraday support. Target: $12.94–$12.85. Invalidation: close back above $13.50 (EMA13 / SMA200D). (50% probability)
- Scenario 2: Neutral/Bullish Oversold Bounce, Fails at Resistance — RSI near 30 and price at the lower band trigger a relief bounce, which stalls at the EMA13 / SMA200D zone. Trigger: hold above $13.04 and RSI turning up above 35. Target: $13.35–$13.50. Invalidation: break below $13.00 on volume. (30% probability)
- Scenario 3: Bearish Accelerated Selloff — A break of SMA50D support leads to a quick drop into the mid-$12s. Trigger: break below $12.90 on heavy volume. Target: $12.60–$12.70. Invalidation: reclaim of $13.20. (20% probability)
PRICE TARGETS
For a 4-day timeframe, the range width should be about 4–8% of price, or roughly $0.55–$1.05. A 4% width is about $0.53, and I'm using about 7% width, or $0.92.
- Target Price: $12.98 (4 days)
- Expected Range: $12.55 to $13.47 (width $0.92 ≈ 7.0%)
- Key Levels: Support at $12.94 (SMA50D), Resistance at $13.47 (SMA200D / EMA13 zone)
OVERALL BIAS
OVERALL BIAS: BEARISH - Price is below the EMAs, VWAP and SMA200D, with a bearish MACD cross, CMF distribution, and ADX of 32.8 with −DI dominating +DI. The path of least resistance is a drift toward the SMA50D near $12.94, though an oversold bounce is a risk given RSI near 30 and price at the lower Bollinger Band.
This is educational analysis and not financial advice.