AAL 6-day bearish forecast — Nov 15, 2026
- Bias: Bearish
- Timeframe: 6 days (made Nov 15, 2026, target date Nov 20, 2026)
- Price at analysis: $13.16
- Price target: $13.00
- Expected range: $12.75 – $13.55
- Result: Pending — graded after the close on Nov 20, 2026
Get a free AI analysis of AAL today
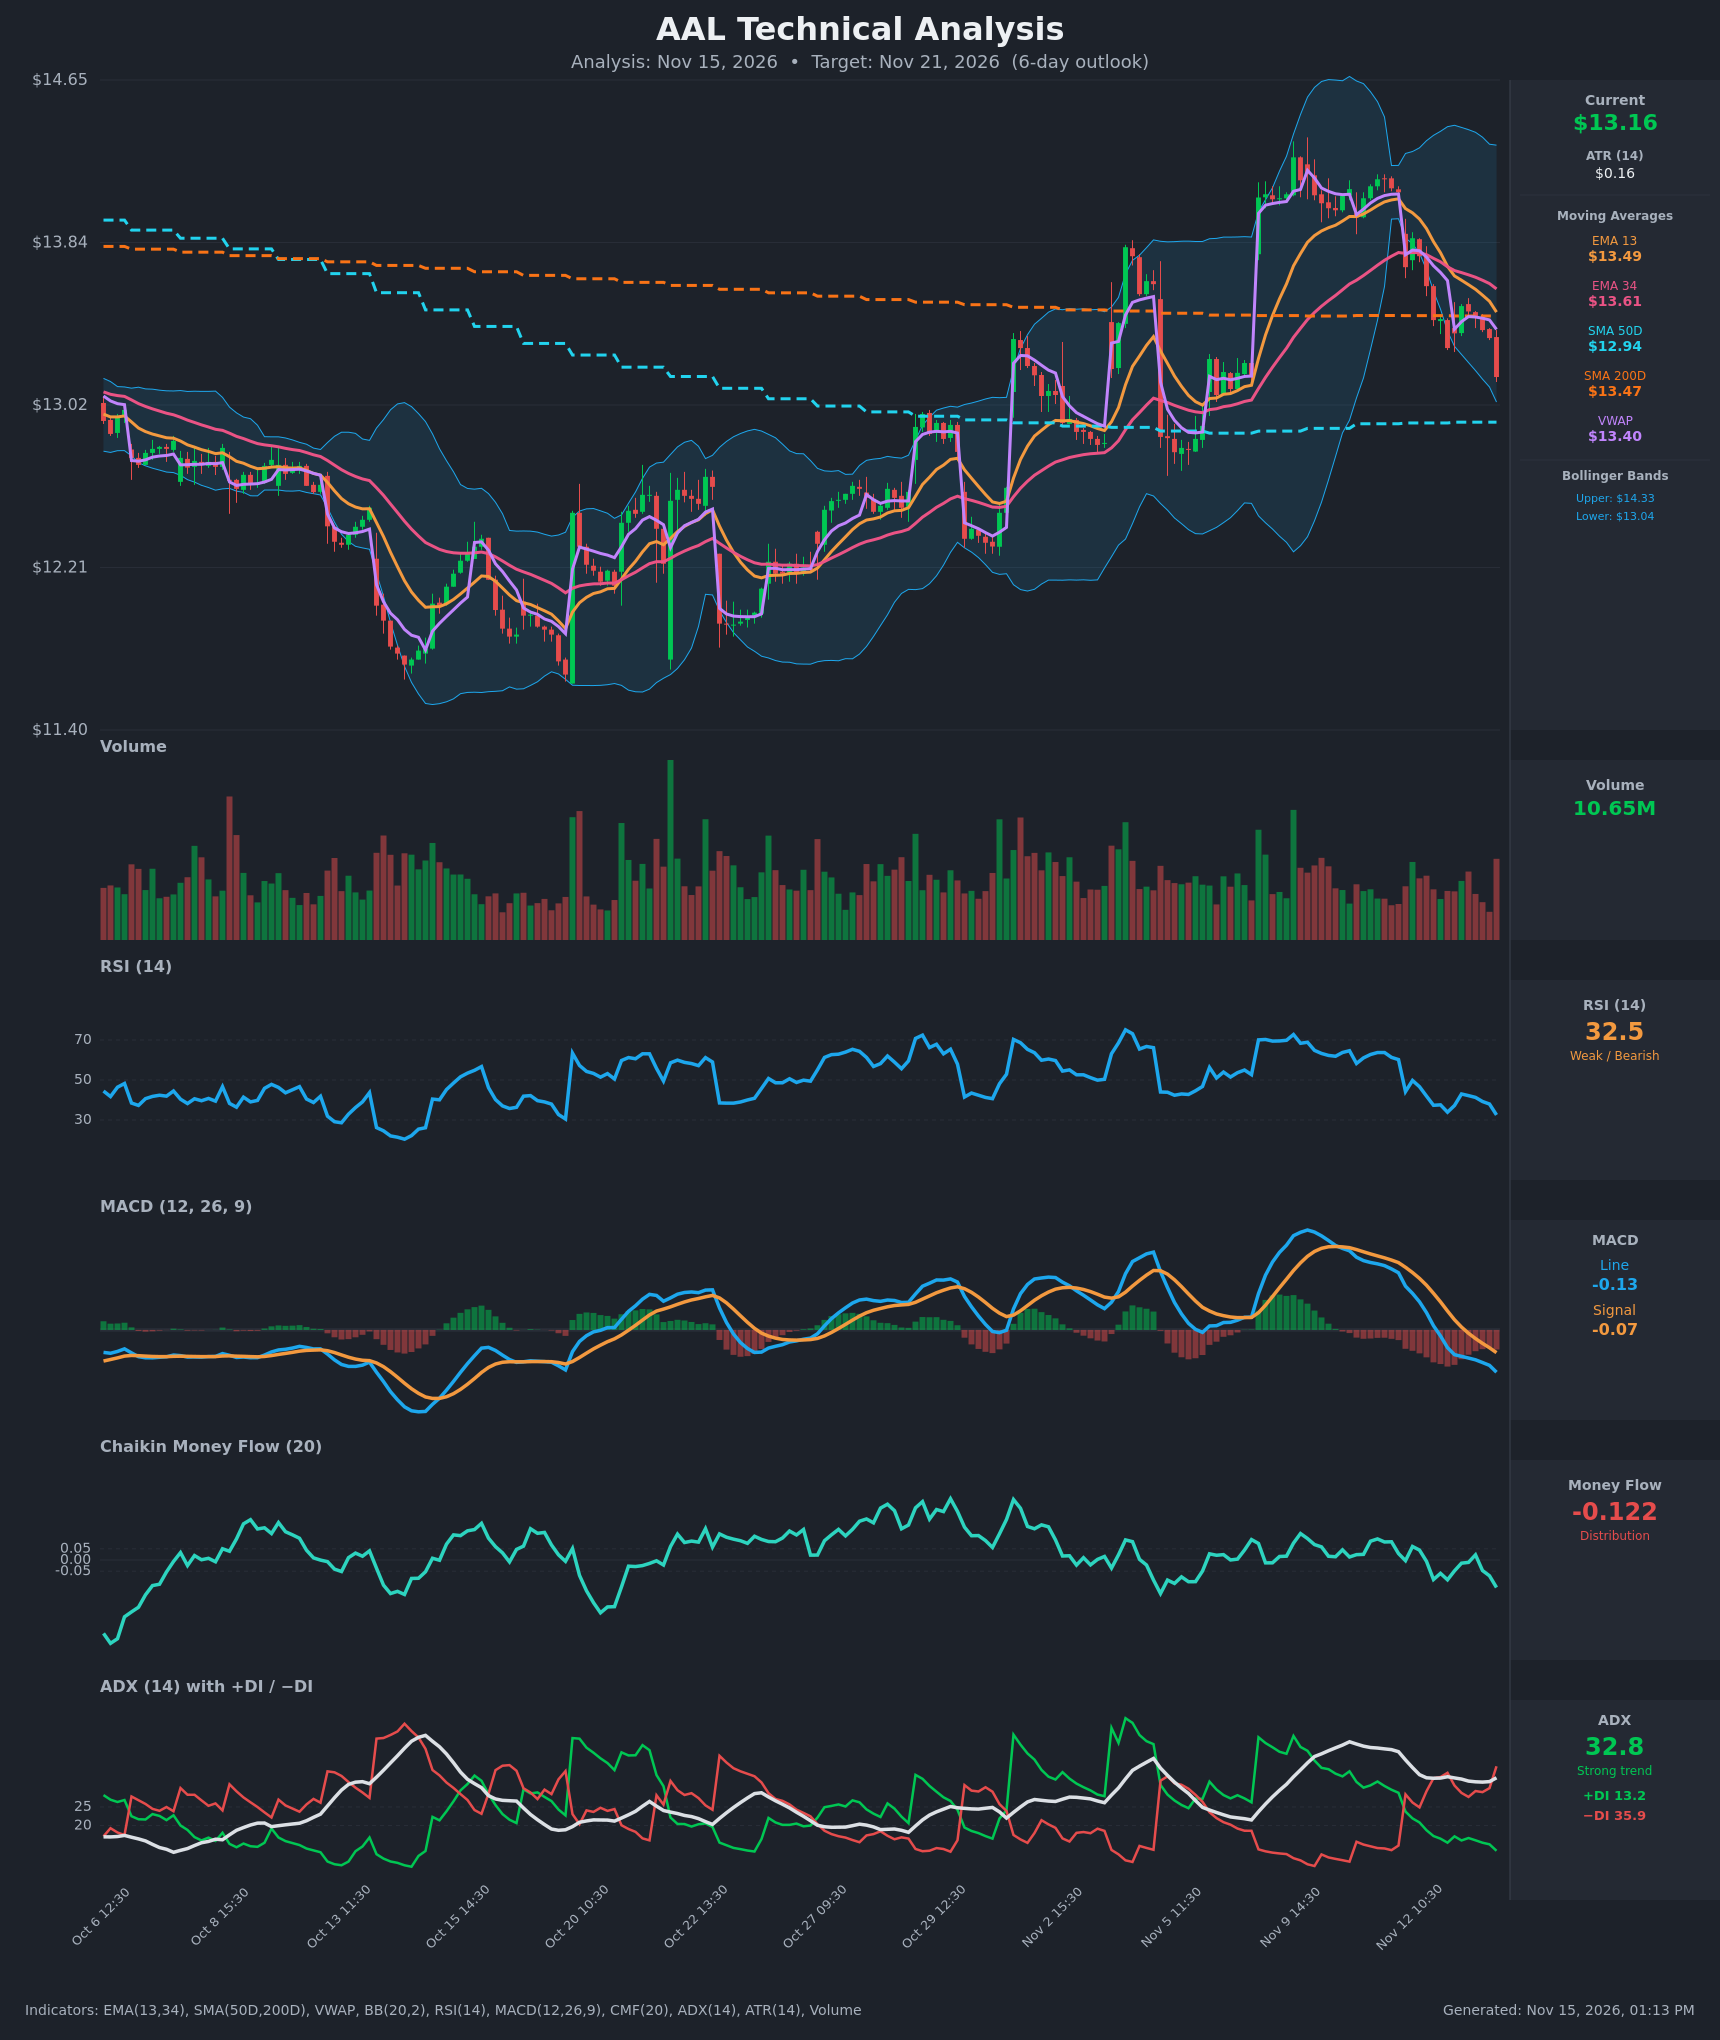
Analysis
TECHNICAL INDICATORS
- RSI (14): 32.53, down from about 60 on Nov 11 and approaching the 30 oversold line. Momentum is falling with no bullish divergence yet. Oversold readings in a strong downtrend can stay oversold or only bounce briefly. [Bearish]
- 20 EMA: The data gives EMA 13 at $13.49 and EMA 34 at $13.61, both above the $13.165 price. EMA13 crossed below EMA34 around Nov 12 15:30, and both are sloping down. Price is below both, so they act as overhead resistance. [Bearish]
- MACD: Line -0.1295 is below signal -0.0696, so the histogram is negative and widening. The bearish crossover came on Nov 12 14:30, and the line has since gone below zero. [Bearish]
- Bollinger Bands (20): Upper $14.33, lower $13.04, with price at $13.165 in the lower quarter of the band, about $0.13 above the lower band. The bands are wide after the earlier rally. Price is walking down toward the lower band, which could mean a bounce or a band-walk continuation. [Bearish]
- CMF (20): -0.122, well below -0.05 and falling from near zero. This points to persistent distribution and selling pressure. [Distribution]
- ADX (14): 32.8 with +DI 13.2 and −DI 35.9. The trend is strong, and the bears are clearly in control, with −DI more than 2.5x +DI. +DI crossed below −DI on Nov 12 and the gap has widened. [Strong Trend – Bearish]
- Volume: 10.65M on the latest red bar, in line with or slightly above recent averages. Down bars in the last few sessions have carried decent volume, and there is no capitulation spike yet. [Mildly Bearish]
DIVERGENCES & TRENDS
- There is no bullish RSI or MACD divergence. Both are making lower lows alongside price, so momentum confirms the decline.
- Price is below VWAP ($13.40), EMA13 ($13.49), EMA34 ($13.61) and SMA200D ($13.47), which shows sellers in control.
- SMA50D ($12.94) is below SMA200D ($13.47). That is a bearish long-term configuration, though price still sits above SMA50D, which is the nearest major support.
- The Nov 9–11 peak near $14.1–14.2 was followed by a sequence of lower highs and lower lows on the hourly chart.
- RSI near 32 and price near the lower Bollinger Band raise the risk of a short-term relief bounce. A bounce would likely be capped at the EMA13/SMA200D zone near $13.47–13.49.
CHART PATTERNS
- There is no clean textbook pattern, but the structure looks like a rounded or double-top-style reversal (Bearish Double Top / Rising Wedge family). Price rallied from about $12.0 to $14.1, then rolled over with lower highs.
- The $12.9–13.0 area is a prior consolidation base from late Oct to early Nov, and it lines up with SMA50D at $12.94. This is the key "neckline" support.
- A break below $12.94 would confirm the reversal. The measured move would then point toward the low-$12s, but that is beyond the 6-day horizon.
- The current drift lower in a descending channel resembles a Bearish Flag/Pennant continuation, which favors a downside resolution.
POTENTIAL SCENARIOS
- Scenario 1: Bearish Continuation to SMA50 Support — Sellers keep control (−DI dominant, MACD widening, CMF negative), and price breaks the lower Bollinger Band and tests the SMA50D and the prior base. Trigger: hourly close below $13.04. Target: $12.90–$13.00, with an extension to about $12.75. Invalidation: close above $13.50 (EMA13/SMA200D). (52% probability)
- Scenario 2: Bullish Oversold Relief Bounce — RSI approaches 30 and price holds the lower band and SMA50D zone, triggering a short-covering bounce back to the moving-average cluster. Trigger: a strong green bar on rising volume above $13.30. Target: $13.40–$13.55 (VWAP, SMA200D, EMA13). Invalidation: close below $13.00. (30% probability)
- Scenario 3: Neutral Choppy Consolidation — Price chops between SMA50D support and VWAP resistance as the trend loses steam. Trigger: ADX rolls over while price holds $13.00–$13.35. Target: about $13.10–$13.25. Invalidation: a decisive break outside $12.90–$13.50. (18% probability)
PRICE TARGETS
Timeframe: 6 days (Nov 21, 2026). The ATR of $0.16 per bar and the strong trend give a roughly 6% range width, scaled for 6 days. Range check: $13.55 − $12.75 = $0.80, which is 6.1% of $13.165 and fits the 4–8% guidance for 7–10 days.
- Target Price: $13.00
- Expected Range: $12.75 to $13.55
- Key Levels: Support at $12.94 (SMA50D), Resistance at $13.47 (SMA200D)
OVERALL BIAS
OVERALL BIAS: BEARISH - Price is below all key short-term averages and VWAP. MACD is bearish and below zero, −DI dominates in a strong ADX trend, and CMF shows distribution. Oversold RSI argues for a bounce, so the downside is likely limited to the $12.94 SMA50D area over the next 6 days.
This is educational analysis and not financial advice.