NOK 4-day bearish forecast — Nov 15, 2026
- Bias: Bearish
- Timeframe: 4 days (made Nov 15, 2026, target date Nov 18, 2026)
- Price at analysis: $8.07
- Price target: $7.97
- Expected range: $7.74 – $8.24
- Result: Pending — graded after the close on Nov 18, 2026
Get a free AI analysis of NOK today
Analysis
TECHNICAL INDICATORS
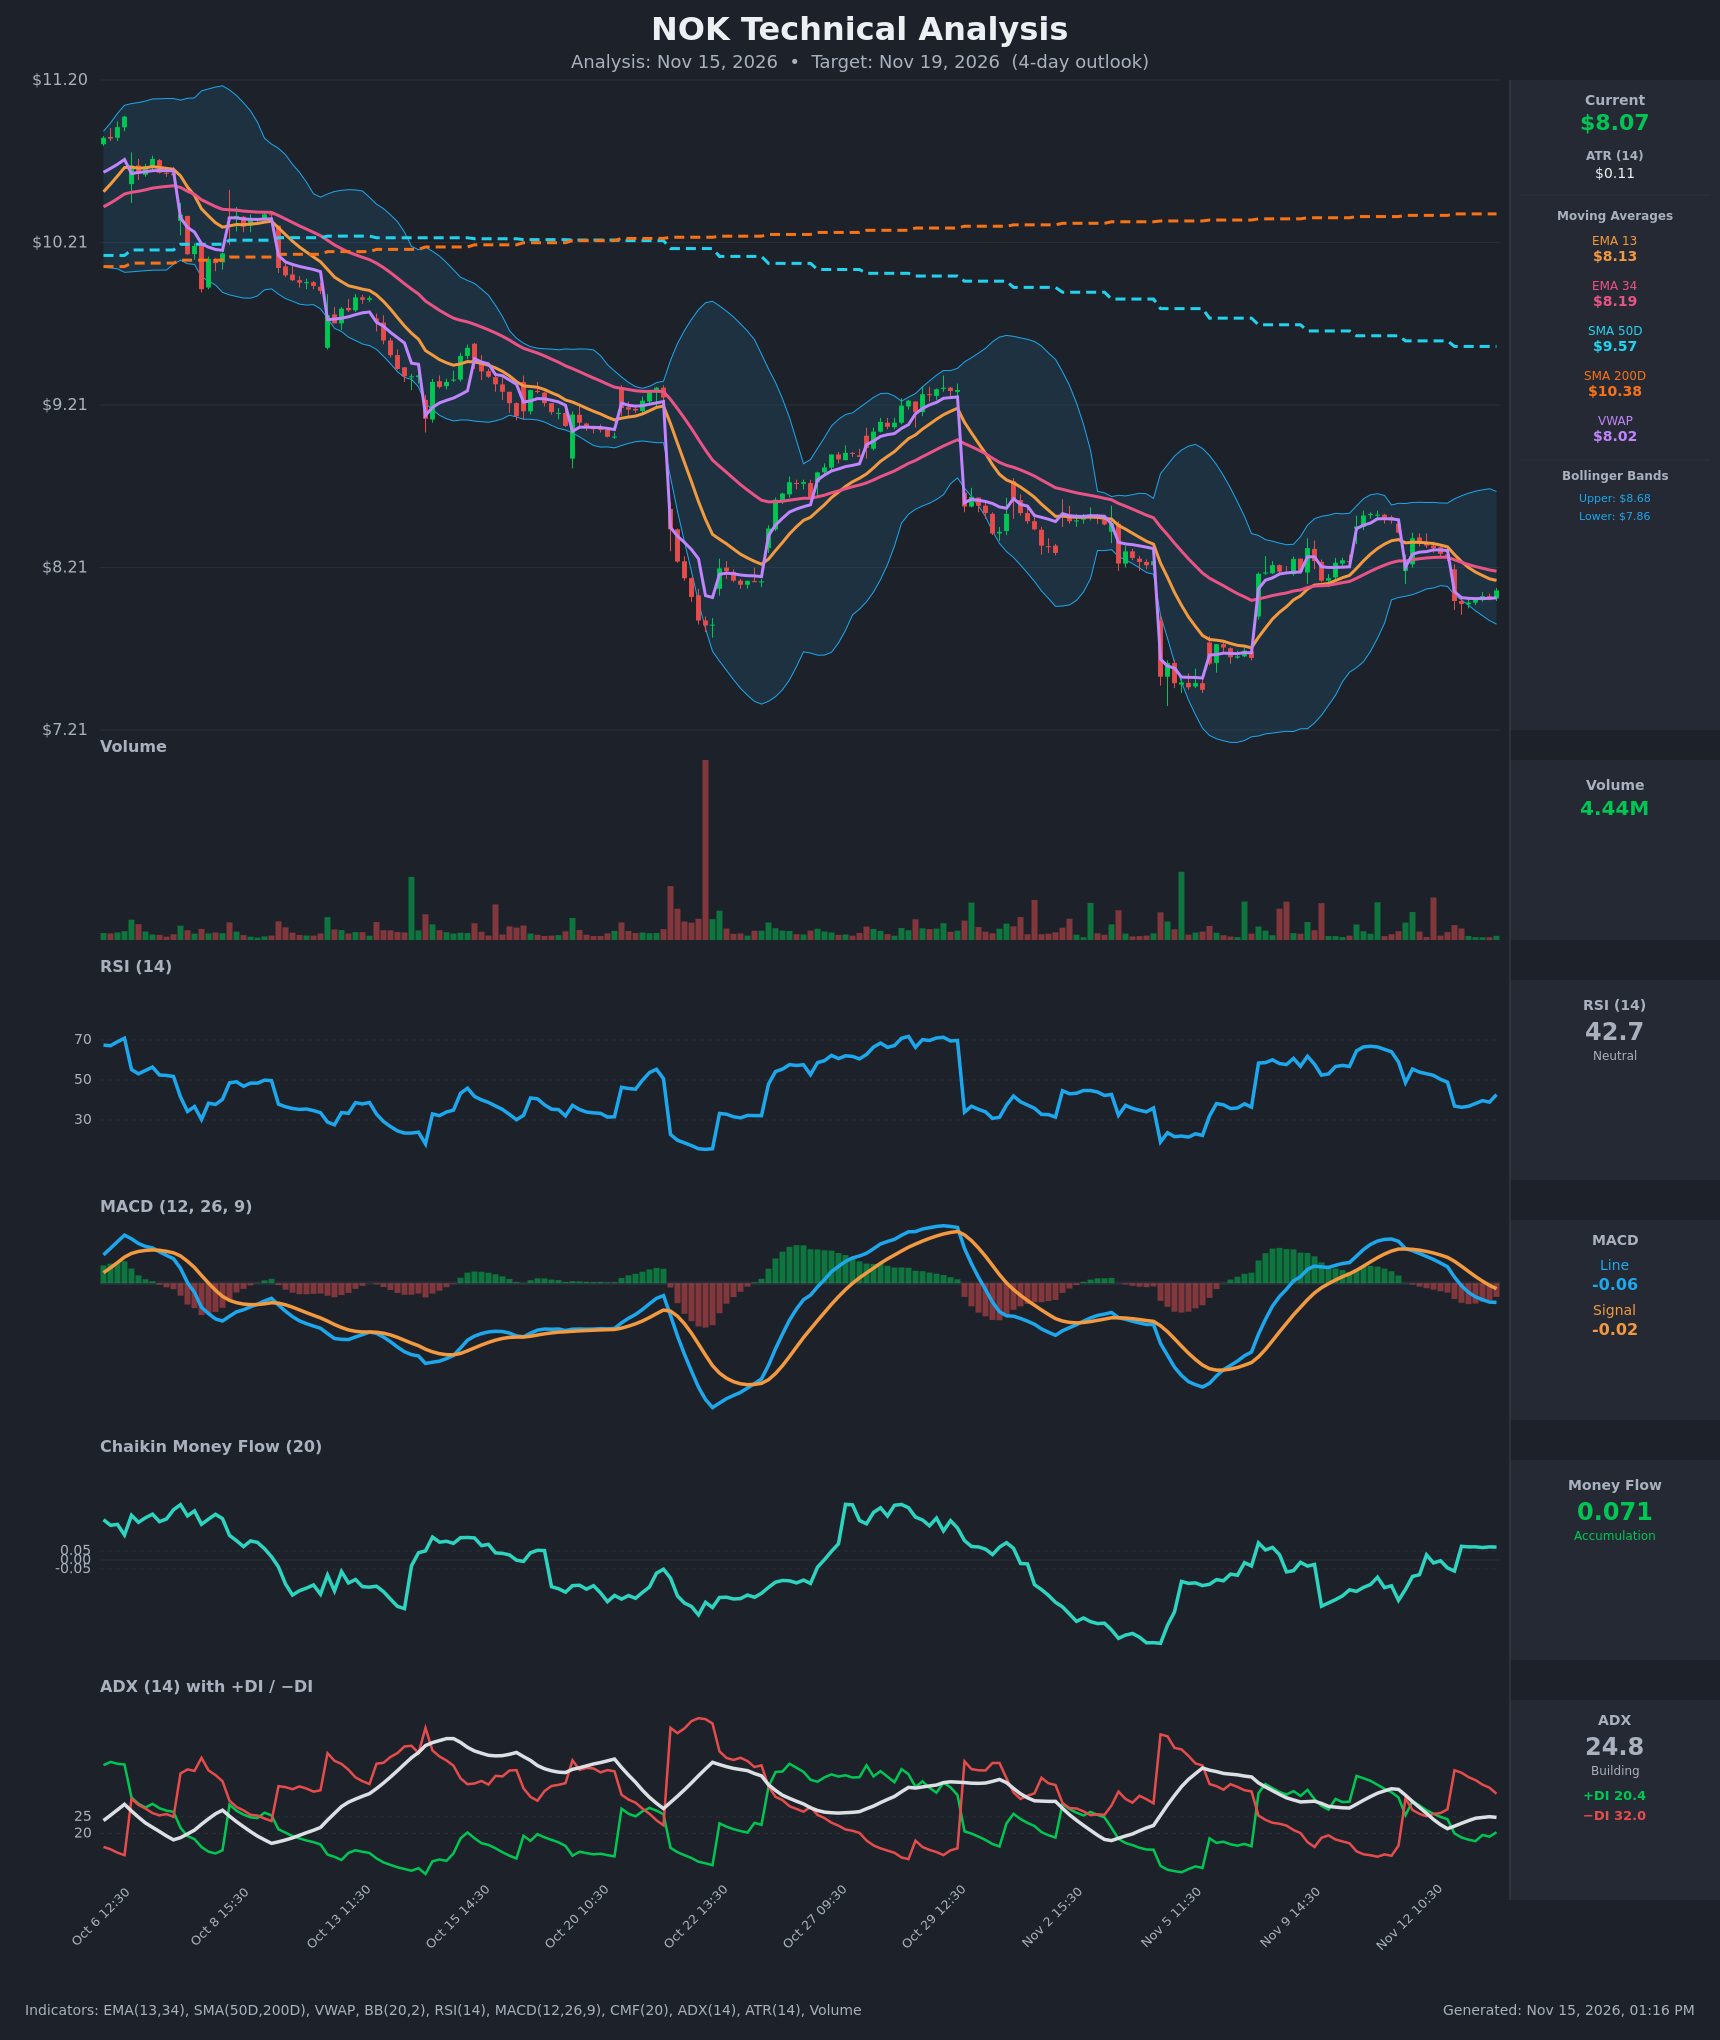
- RSI (14): 42.70, recovering from 36–37 lows after the Nov 13 gap-down. It sits below the 50 midline but is turning up. Not oversold, and momentum is only slightly improving. [Neutral]
- 20 EMA: The chart shows EMA 13 at $8.13 and EMA 34 at $8.19 (no 20 EMA is plotted, so I use these as proxies). Price at $8.07 is below both, and EMA13 crossed below EMA34 on Nov 13. Both act as overhead resistance. [Bearish]
- MACD: Line -0.056 is below signal -0.016, after a bearish cross on Nov 13 14:30. The histogram is negative and widening, and the line is only just flattening. [Bearish]
- Bollinger Bands (20): Upper $8.68, lower $7.86. Price at $8.07 is in the lower third of the bands, which are moderately wide. It is not at the lower band, so there is room to drift toward $7.86 but no extreme reading. [Neutral]
- CMF (20): 0.071, a mild accumulation reading that has improved from the -0.22 area on Nov 11. It is the one constructive signal and conflicts with price weakness. [Accumulation]
- ADX (14): 24.8, near the 25 trend threshold. −DI 32.0 is above +DI 20.4, so bears are in control. The DI spread narrowed from 39 to 32 in the final bars, a sign of selling pressure fading. [Moderate Trend – Bearish]
- Volume: 4.44M, low relative to the large spikes seen earlier in the chart. Recent bars show drifting, muted volume, so the bounce lacks conviction, as does the selling. [Neutral / Low Participation]
DIVERGENCES & TRENDS
- Price is in a clear long-term downtrend: below SMA50D ($9.57) and SMA200D ($10.38). The SMA50D is also below SMA200D, so a death cross is in place and the long-term trend is bearish.
- CMF has turned positive (0.071) while price made a lower low. This is a mild bullish divergence, but it is not confirmed by RSI or MACD.
- RSI is curling up from 36.4 and the MACD line is flattening (-0.055 to -0.056), which suggests short-term downside momentum is easing.
- EMA13 crossed below EMA34 on Nov 13, and MACD crossed bearish. Price is also holding just above VWAP ($8.02), which gives short-term support.
- The pattern over the last month is lower highs and lower lows, with bounces fading below the EMA cluster near $8.40–$8.50.
CHART PATTERNS
- The broader structure is a downtrend with repeated rallies failing, resembling a Bearish Flag/Pennant continuation forming at the lows. This is not a clean match.
- The most recent range between $7.99 and $8.07 is a tight consolidation after the gap-down, consistent with a small bearish pennant. A break below $7.99 targets about $7.75–$7.85, close to the lower Bollinger Band and the prior Nov 5 low zone near $7.50.
- No clear reversal pattern such as a double bottom has completed yet. A reclaim of $8.19 would be needed to negate the bearish continuation.
POTENTIAL SCENARIOS
- Scenario 1: Bearish Continuation Lower — Price is rejected at the EMA13/34 cluster ($8.13–$8.19) and breaks the $7.99 consolidation low, with −DI still dominant and MACD below signal. Trigger: break and hold below $7.99. Target: $7.80–$7.86 (lower Bollinger Band). Invalidation: close above $8.19. (50% probability)
- Scenario 2: Neutral Range Chop — Price holds above VWAP and $7.99 while CMF accumulation offsets bearish trend signals, giving sideways action between $7.95 and $8.20. Trigger: low volume with RSI stuck at 40–48. Target: $8.00–$8.15. Invalidation: close outside $7.95–$8.20. (25% probability)
- Scenario 3: Bullish Relief Bounce — CMF accumulation and an RSI turn lead to a reclaim of the EMA cluster. Trigger: break above $8.19 on rising volume. Target: $8.40–$8.50 (prior resistance, mid Bollinger Band). Invalidation: drop back below $8.00. (25% probability)
PRICE TARGETS
- Target Price: $7.97 (4-day horizon, a modest drift lower consistent with the bearish structure and ATR of $0.106)
- Expected Range: $7.74 to $8.24 (width $0.50 = 6.2% of current price, within the guidance for ~4 days)
- Key Levels: Support at $7.86 (lower Bollinger Band; near-term $7.99), Resistance at $8.19 (EMA34, just above EMA13 at $8.13)
OVERALL BIAS
OVERALL BIAS: BEARISH - Price is below all key moving averages with a death cross in place, a bearish MACD cross, and −DI well above +DI. The mild CMF accumulation and softening RSI limit conviction, so I expect only a modest decline toward $7.97.
This is educational analysis and not financial advice.