NOK 6-day bearish forecast — Nov 15, 2026
- Bias: Bearish
- Timeframe: 6 days (made Nov 15, 2026, target date Nov 20, 2026)
- Price at analysis: $8.07
- Price target: $7.90
- Expected range: $7.65 – $8.18
- Result: Pending — graded after the close on Nov 20, 2026
Get a free AI analysis of NOK today
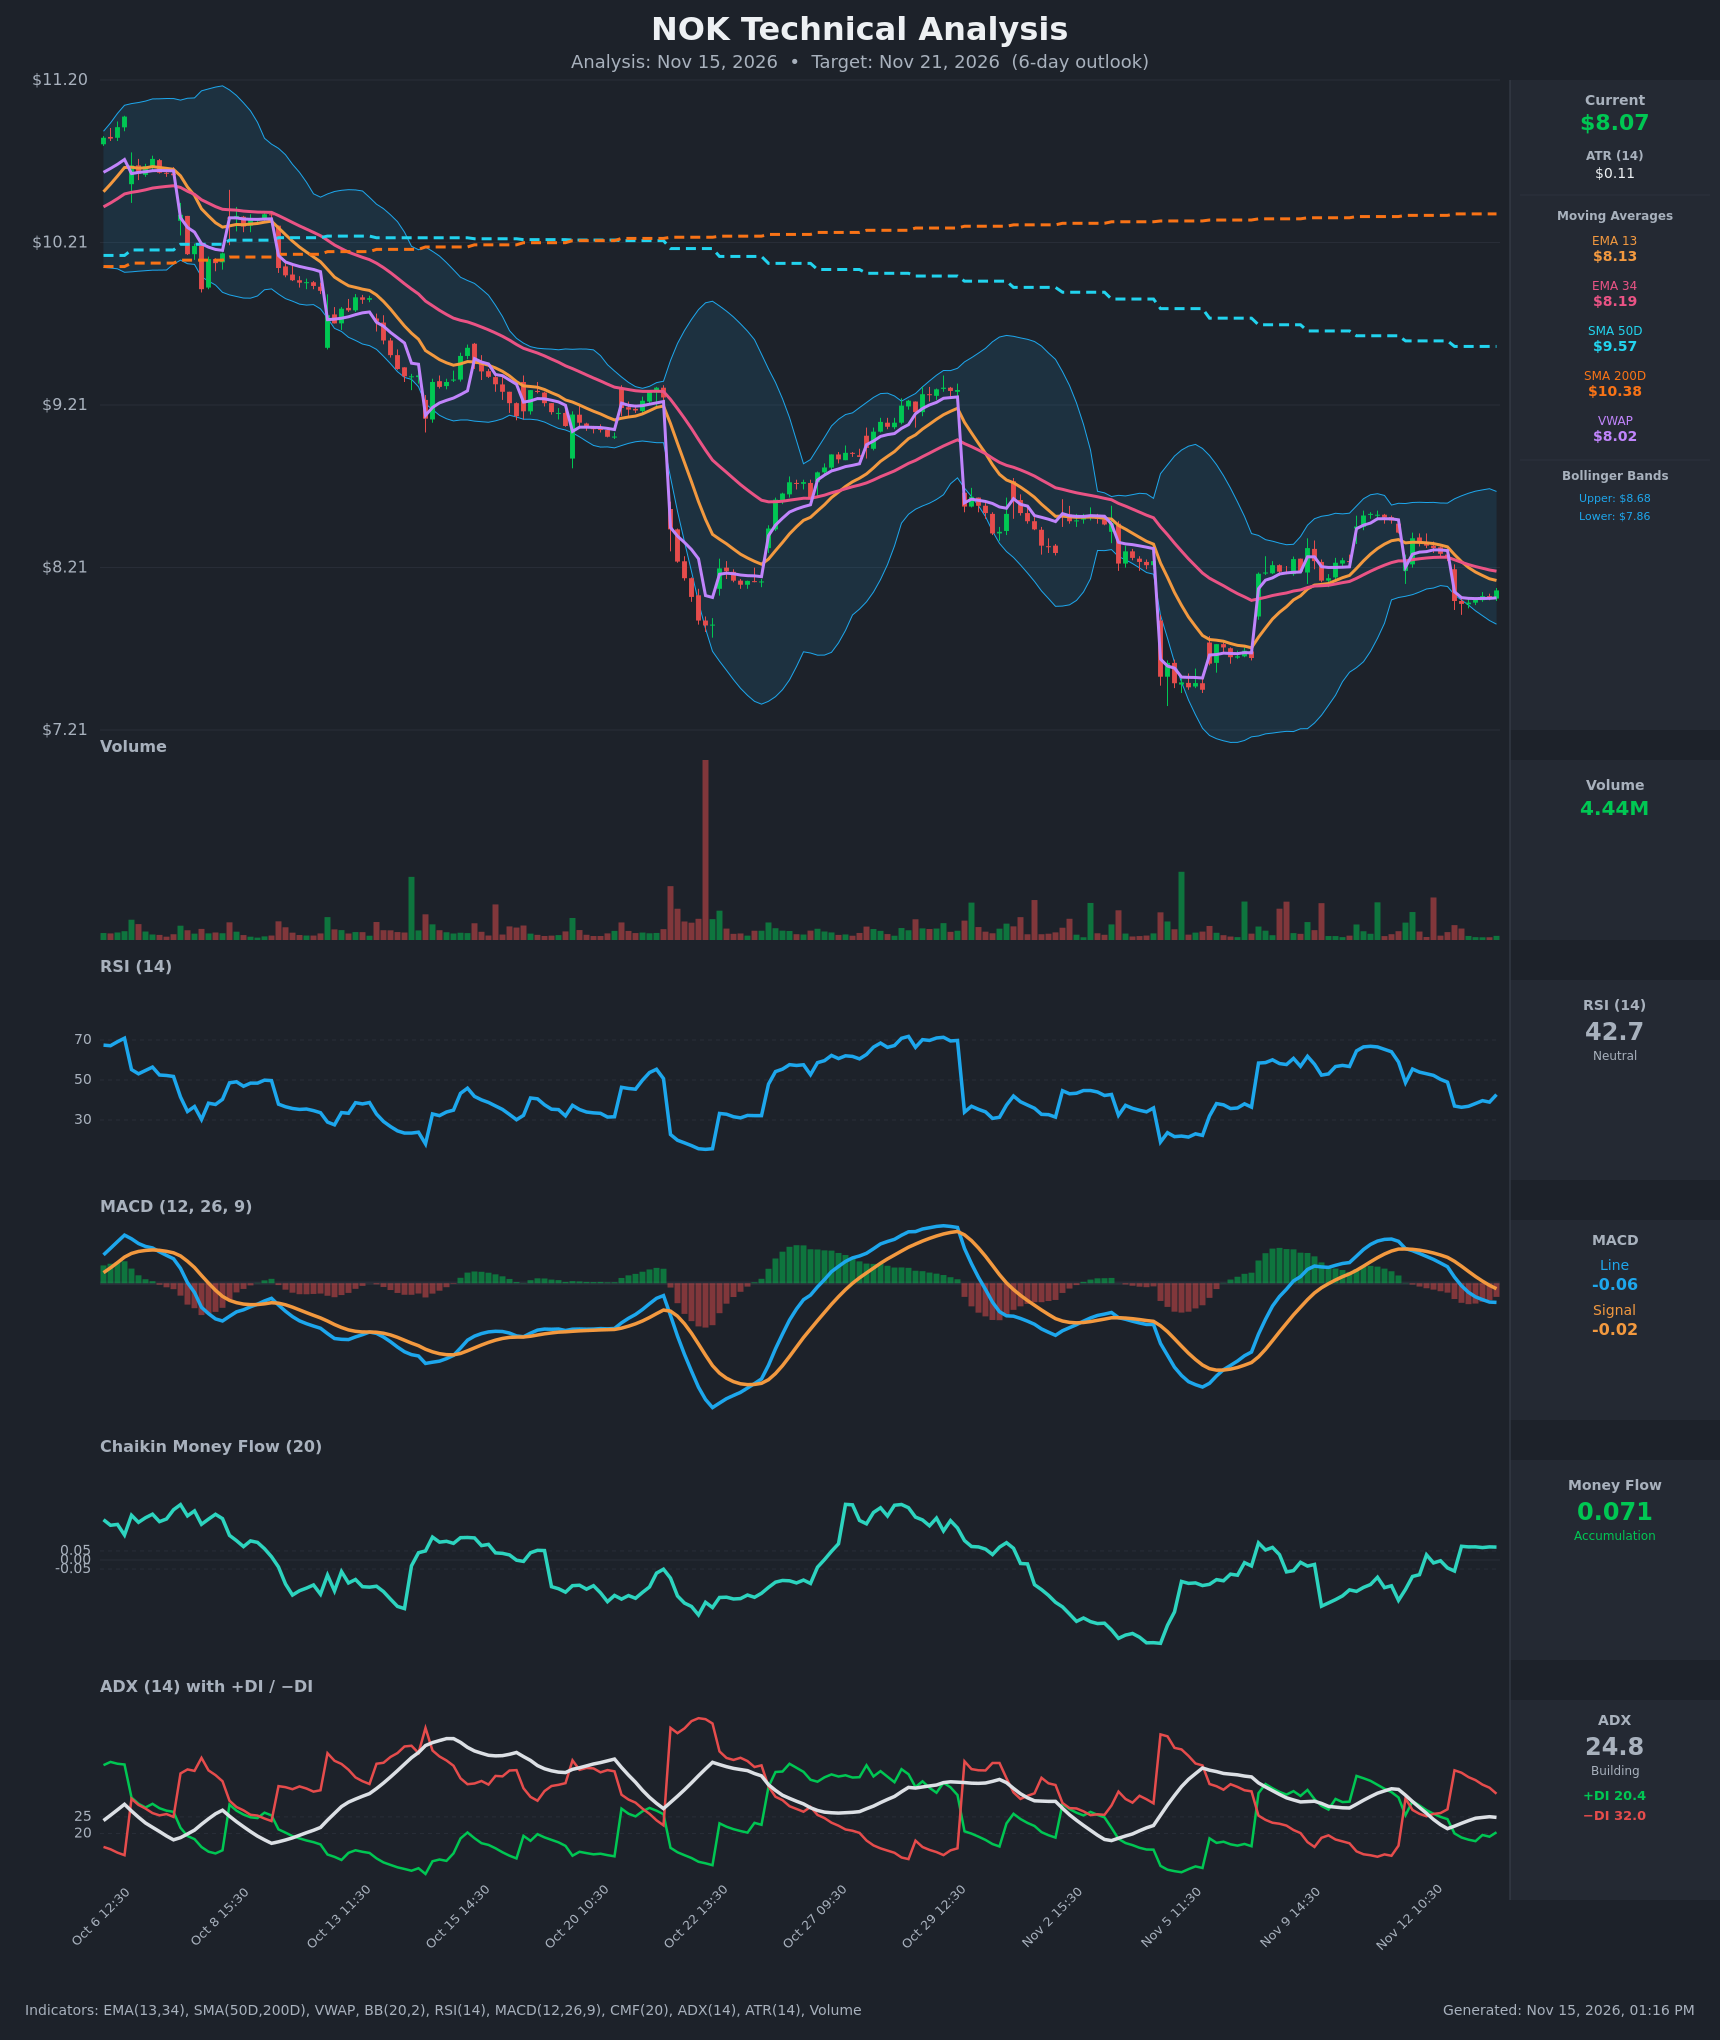
Analysis
TECHNICAL INDICATORS
- RSI (14): 42.70, below the 50 midline but above oversold. It collapsed from 53 to the 36-37 area on the Nov 13 gap down and has ticked up to 42.7 from a low of 36.4, so momentum is weak with only a modest bounce. [Bearish]
- 20 EMA: The chart uses EMA 13 ($8.13) and EMA 34 ($8.19). Price at $8.07 is below both, and EMA13 crossed below EMA34 on Nov 13, around the 10:30 bar. Both slope down and act as overhead resistance. [Bearish]
- MACD: Line -0.056 is below signal -0.016 and below zero. The bearish crossover happened on Nov 13, and the histogram is negative and still widening (about -0.04). [Bearish]
- Bollinger Bands (20): Upper $8.68, lower $7.86, so price sits in the lower quarter of the band, about $0.21 above the lower band. The bands are fairly wide. A walk toward the lower band is possible, but a mean-reversion bounce toward the midline (about $8.27) is also plausible. [Neutral]
- CMF (20): +0.071, just above the +0.05 accumulation threshold. It has held slightly positive for several bars, which is a mild positive divergence against falling price, but it is only marginally above the threshold. [Accumulation]
- ADX (14): 24.8, near the 25 trend threshold and rising slightly. −DI (32.0) is well above +DI (20.4), so sellers control a moderate-strength downtrend. [Moderate Trend, Bearish]
- Volume: 4.44M, with recent bars on the chart looking light. The bounce from $7.99 to $8.07 is on subdued volume, while the Nov 13 gap-down had heavier selling. Low-volume bounces tend to be corrective. [Bearish-leaning / weak buying]
Other context:
- Price is below the VWAP-anchored level of $8.02 only marginally, and sits just above it. That is a minor positive.
- Price is below the SMA50D ($9.57) and the SMA200D ($10.38). SMA50 is below SMA200, so the death cross is long established and the long-term trend is down.
DIVERGENCES & TRENDS
- Positive CMF divergence (mild): CMF stays above zero while price makes lower lows, which hints at some absorption near $8.00. It is not strong enough to override the trend signals.
- No RSI divergence: RSI is making lower highs in line with price (about 66 on Nov 10 down to 53 and now 42).
- Trend: The chart shows a clear sequence of lower highs since early October ($10.8 to $9.3 to $8.9 to $8.5 to $8.4). The Nov 5 low near $7.50 was bought, but the bounce has now faded.
- Crossovers: EMA13 fell below EMA34, the MACD crossed below its signal, and −DI crossed above +DI on Nov 13. All three are bearish.
- ADX: It is flattening around 25, so trend strength is moderate and not accelerating.
CHART PATTERNS
- Downtrend with lower highs: The structure is a descending channel since October.
- Tentative bearish flag/pennant: Price has consolidated in a narrow range ($7.99-$8.07) after the sharp drop on Nov 13. This is only a few bars old, so it is a weak match. If it resolves down, the measured move targets the $7.50 area (the Nov 5 low). Over 6 days, a partial move to about $7.85-$7.90 is more realistic.
- Bullish counter-case: The Nov 5 low and the Nov 13 low form a loose double-bottom-like area around $7.50-$8.00. It needs a break above $8.50, and nothing confirms it yet.
POTENTIAL SCENARIOS
- Scenario 1: Bearish Continuation Lower — Price stays below EMA13/EMA34 and the −DI dominance persists. Sellers push toward the lower Bollinger Band and below the recent $7.99 low. Trigger: a hourly close below $7.99, then below $7.86. Target: $7.75-$7.90, with an extension to $7.50. Invalidation: a close above $8.19 (EMA34). (50% probability)
- Scenario 2: Neutral Range Chop — Price consolidates around VWAP ($8.02) between the lower Bollinger Band and the EMAs, as positive CMF offsets weak momentum. Trigger: repeated failures at $8.13-$8.19 and holds above $7.90. Target: $7.95-$8.15 at the end of the period. Invalidation: a close outside $7.85-$8.20. (20% probability)
- Scenario 3: Bullish Relief Bounce — A mean-reversion bounce, supported by CMF accumulation and oversold-ish RSI, toward the Bollinger midline. Trigger: a close above $8.19 with a MACD histogram turn. Target: $8.30-$8.45. Invalidation: a close below $7.95. (30% probability)
PRICE TARGETS
- Target Price: $7.90 (6-day outlook, about -2.1% from $8.07)
- Expected Range: $7.65 to $8.18 (width about $0.53, or 6.6% of the current price, which is consistent with the 6-day guidance of 4-8%)
- Key Levels: Support at $7.86 (lower Bollinger Band, with $7.50 as the deeper swing low), Resistance at $8.19 (EMA34, with $8.68 at the upper Bollinger Band)
OVERALL BIAS
OVERALL BIAS: BEARISH - Price is below all key moving averages with a bearish MACD crossover, −DI well above +DI, and weak RSI. The mildly positive CMF and the lower-Bollinger-band location argue for a limited downside, but the evidence tilts toward a drift lower.
This is educational analysis and not financial advice.