AMD 6-day bearish forecast — Nov 15, 2026
- Bias: Bearish
- Timeframe: 6 days (made Nov 15, 2026, target date Nov 20, 2026)
- Price at analysis: $534.09
- Price target: $523.50
- Expected range: $508.00 – $543.00
- Result: Pending — graded after the close on Nov 20, 2026
Get a free AI analysis of AMD today
Analysis
TECHNICAL INDICATORS
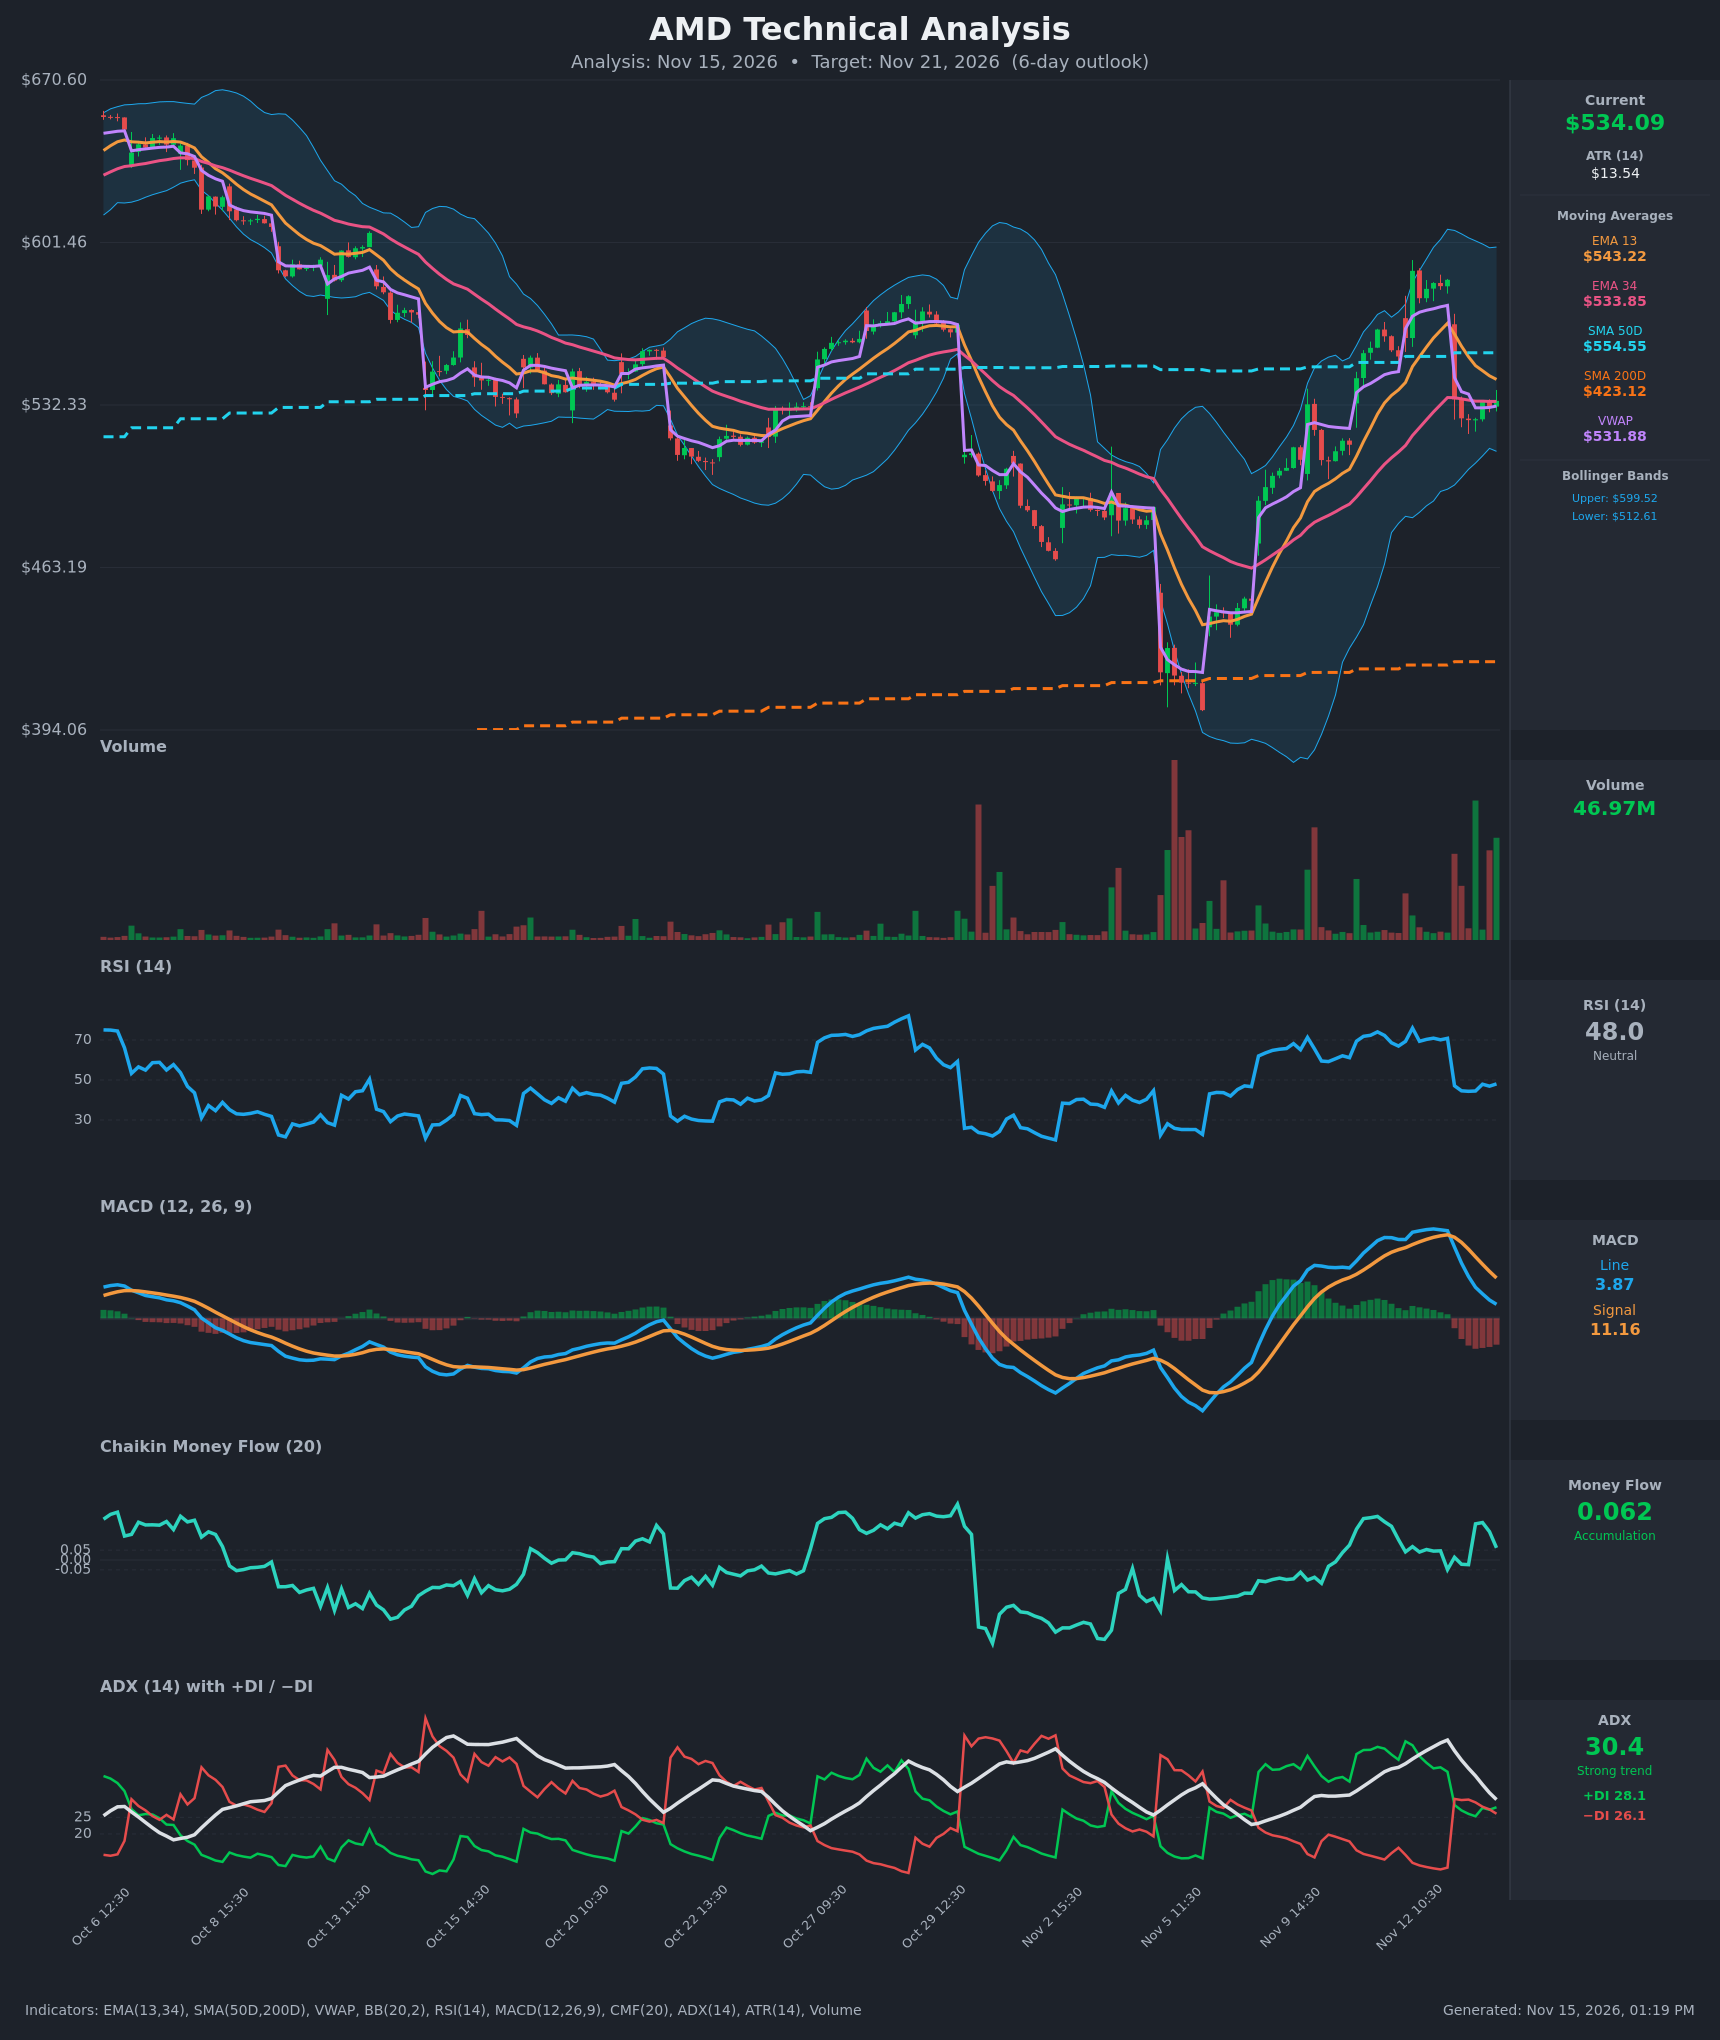
- RSI (14): 48.05, neutral. It collapsed from ~70 to the mid-40s on the Nov 13 gap-down and has been flat at 44-48 since. There is no oversold bounce setup yet, and momentum has reset rather than recovered. [Neutral]
- 20 EMA: The chart uses EMA 13 ($543.22) and EMA 34 ($533.85). Price at $534.09 sits below the EMA 13, which is now resistance and sloping down. It is pinned right on the EMA 34, the last line of short-term support. EMA 13 is still above EMA 34, but the gap has narrowed from ~$30 to ~$9.4, so a bearish cross is close. [Bearish]
- MACD: Line 3.87 is below signal 11.16, and the bearish crossover happened on Nov 13. The histogram is negative (about -7.3) and was still widening at the last bar, though less steeply than at first. The line is heading toward zero, so momentum is fading. [Bearish]
- Bollinger Bands (20): Upper $599.52, lower $512.61, midline about $556. Price is in the lower half of the bands, about $21 above the lower band. The bands are wide after the recent volatility spike. There is no squeeze, and a drift toward the lower band is the path of least resistance. [Bearish]
- CMF (20): 0.062, just above the +0.05 accumulation threshold. It has faded from ~0.19 and is hovering near neutral, so buying support is weakening. [Accumulation (marginal)]
- ADX (14): 30.4 and falling from 48. The trend is still technically strong, but it is decaying. +DI (28.1) is barely above −DI (26.1), and the DIs are converging after the bearish flip on the gap. Trend control is contested. [Weakening Trend, Neutral]
- Volume: 46.97M, well above the quiet-day average, with heavy volume on the Nov 12-13 gap move. The selling was high-volume distribution, and the stabilization since has come on lighter volume, so it lacks conviction. [Bearish-leaning]
Other levels: price is slightly above VWAP ($531.88) and below SMA50D ($554.55). It is far above SMA200D ($423.12), so the long-term trend is up. The SMA50D is above the SMA200D, so there is no death cross.
DIVERGENCES & TRENDS
- There is no clear divergence. The Nov 12 spike to ~$589 came with RSI above 76 and a MACD high, and it was fully reversed the next session. That is a classic exhaustion or blow-off.
- MACD crossed bearish and is trending toward zero. ADX is declining from 48, so the impulsive move has ended.
- The DIs have nearly converged, and a −DI cross above +DI would confirm sellers taking control.
- EMA 13 is converging down toward EMA 34. A bearish cross is likely within days unless price rallies.
- Price has failed to reclaim the SMA50D ($554.55), which acted as resistance around the $585 spike.
- CMF fading toward zero shows buyer participation drying up.
CHART PATTERNS
- The rally from ~$440 to ~$585 followed by an 8.7% gap-down resembles a failed breakout and reversal, closest to a Bearish Rising Wedge. The Nov 5-12 advance made higher lows and higher highs in a narrowing channel before breaking down.
- The tight 5-bar consolidation at $525-$534 after the drop looks like a small Bearish Flag/Pennant. A break below $525 targets roughly the flagpole measure, but over 6 days I expect only partial follow-through, toward $512 (the lower BB).
- The stabilization is not yet a bullish reversal pattern, since there is no higher-low sequence or volume-backed breakout.
POTENTIAL SCENARIOS
- Scenario 1: Bearish Flag Breakdown — Price fails at the declining EMA 13 and breaks the $525-526 consolidation low. The EMA 13/34 bearish cross and a −DI > +DI crossover add pressure. Trigger: close below $525.90 on rising volume. Target: $512-$520 (lower Bollinger Band area). Invalidation: close back above $543.22 (EMA 13). (50% probability)
- Scenario 2: Bullish Relief Bounce — The EMA 34 and VWAP hold, CMF stays positive, and price rebounds toward the falling EMA 13 and then the SMA50D. Trigger: reclaim of $543 with volume. Target: $554.55 (SMA50D). Invalidation: close below $525.90. (35% probability)
- Scenario 3: Neutral Range Chop — Price holds between $525 and $543 as ADX continues to fall and the DIs intertwine. Trigger: no break of either boundary. Target: $530-$538. Invalidation: close outside $525-$543. (15% probability)
PRICE TARGETS
The expected range is $508.00 to $543.00, a width of $35.00, or about 6.6% of the $534.09 current price. That fits the 4-8% guideline for a 6-day timeframe.
- Target Price: $523.50 (6 days out)
- Expected Range: $508.00 to $543.00
- Key Levels: Support at $512.61 (lower Bollinger Band, with $525.90 as the nearer recent low), Resistance at $543.22 (EMA 13, then $554.55 SMA50D)
OVERALL BIAS
OVERALL BIAS: BEARISH - The bearish MACD crossover, price below the declining EMA 13 and SMA50D, the post-blow-off gap reversal on heavy volume, and fading CMF and ADX favor a drift lower toward the lower Bollinger Band. The EMA 34/VWAP cluster near $532-$534 is the key near-term support, and a loss of $525.90 would accelerate the move.
This is educational analysis and not financial advice.