AMD 4-day bearish forecast — Nov 15, 2026
- Bias: Bearish
- Timeframe: 4 days (made Nov 15, 2026, target date Nov 18, 2026)
- Price at analysis: $534.09
- Price target: $527.00
- Expected range: $514.00 – $543.00
- Result: Pending — graded after the close on Nov 18, 2026
Get a free AI analysis of AMD today
Analysis
TECHNICAL INDICATORS
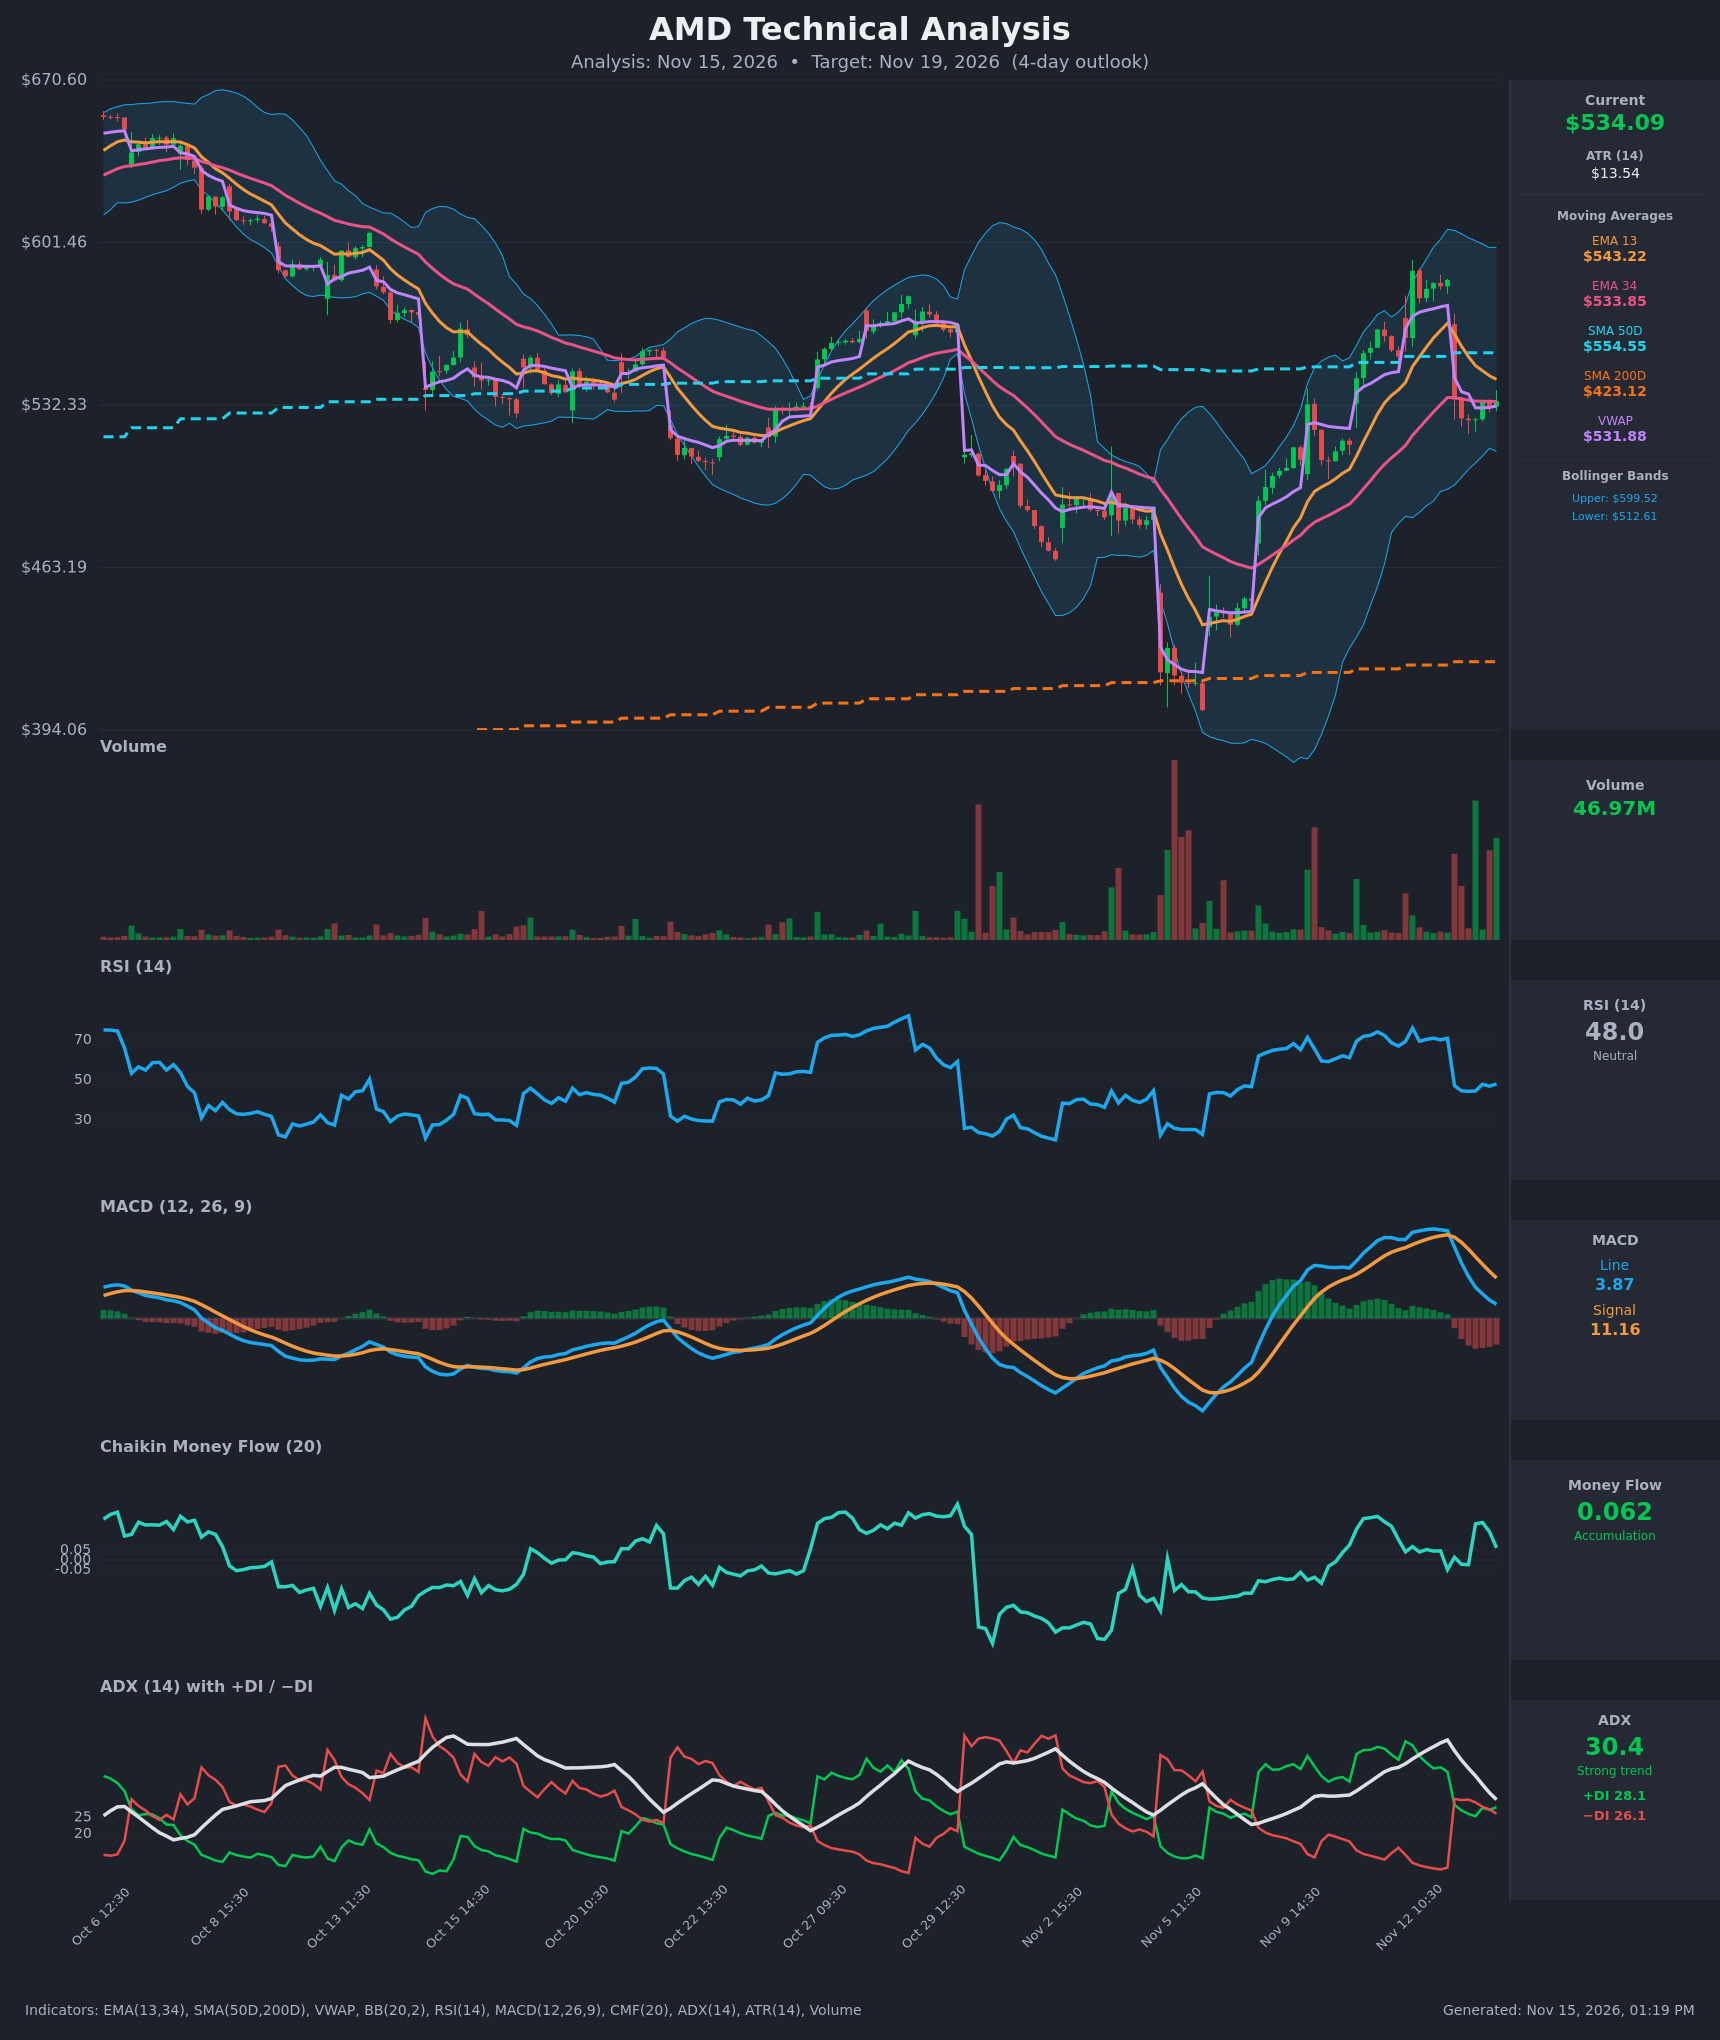
- RSI (14): 48.05, neutral. It collapsed from about 70 to about 45 on the Nov 13 gap down and has since flattened between 44 and 48. Momentum has reset but has not turned oversold or started a recovery. [Neutral]
- 20 EMA: Only the EMA 13 ($543.22) and EMA 34 ($533.85) are supplied, so I use them as the short-term proxy. Price ($534.09) sits right on the EMA 34 and about $9 below the falling EMA 13, which is overhead resistance. EMA 13 is still above EMA 34 but the gap is shrinking fast, and a bearish crossover is close. [Bearish]
- MACD: Line 3.87 is below Signal 11.16, a bearish crossover that occurred on Nov 13. The histogram is about -7.3 and has narrowed slightly from about -8.4. The line is still falling toward zero, so the loss of momentum is not yet complete. [Bearish]
- Bollinger Bands (20): Upper $599.52, lower $512.61, so the midline is about $556. Price is in the lower half of the bands, about $21 above the lower band. The bands are wide after the volatile spike, and a midline reclaim looks unlikely in 4 days. [Neutral to slightly Bearish]
- CMF (20): 0.062, just above the +0.05 threshold. It has eased from 0.19 and has been bouncing around zero since the gap. This is marginal accumulation and is fading. [Accumulation (weak)]
- ADX (14): 30.4 and falling sharply from about 48, so the earlier uptrend is exhausting. +DI is 28.1 and −DI is 26.1, nearly crossed. Bulls hold only a slim edge after the −DI spike. [Fading Trend, directionally undecided]
- Volume: 46.97M, elevated. The highest-volume bars sit at the Nov 12 spike and the Nov 13 reversal. A high-volume spike followed by a gap down looks like blow-off or distribution behavior, and the bounce since has come on lighter volume. [Bearish-leaning]
DIVERGENCES & TRENDS
- Price made a high near $589 on Nov 12 with RSI above 76, then reversed hard. This is a classic exhaustion and reversal signature.
- The MACD bearish crossover came before price fell below the SMA 50, so it was an early warning.
- CMF is still slightly positive while price has dropped about 9% from its high. This is a mild bullish divergence, but CMF is falling.
- The Nov 13 gap from $585 to $535 is unfilled and acts as overhead supply in the $545-$585 area.
- Price is consolidating on EMA 34 and VWAP ($531.88). The $525-$534 lows are holding for now.
- Price is below the SMA 50 ($554.55) and well above the SMA 200 ($423.12). The long-term trend is up, but the medium-term trend is mixed. There is no golden or death cross, since the SMA 50 has been above the SMA 200 for some time.
- The DI lines are converging and a −DI crossover is possible. Falling ADX means any move will be less forceful than the previous one.
CHART PATTERNS
- Bearish Rising Wedge / blow-off reversal: The reference diagram's reversal setup fits loosely. The Nov 5-12 rally rose into a high-volume spike and then reversed sharply, though a clean wedge is not visible.
- Bearish Flag/Pennant (continuation): The tight $525-$534 chop after the gap-down drop resembles a small pause. A break below $525 would project a measured move toward about $510-$512, near the lower Bollinger Band. The structure is only a few bars old, so confidence is moderate.
- Larger context: Price has been range-bound between about $463 and $585, with the EMA 34/SMA 50 zone acting as a pivot. This range limits the downside.
POTENTIAL SCENARIOS
- Scenario 1: Bearish Gap-Fade Continuation — Price rejects the EMA 13 area and the MACD stays below signal. Sellers push price below the $525 consolidation low toward the lower Bollinger Band. Trigger: Close below $525.00 on rising volume. Target: $515-$520. Invalidation: Close above $545. (50% probability)
- Scenario 2: Bullish Relief Bounce — Price holds the EMA 34/VWAP, CMF stays positive and MACD histogram keeps narrowing. Price retests the gap-fill resistance. Trigger: Break above $543.22 (EMA 13). Target: $550-$555 (SMA 50). Invalidation: Close below $525. (30% probability)
- Scenario 3: Neutral Consolidation — Price chops around the EMA 34 while ADX keeps falling. Trigger: Daily closes between $525 and $543. Target: $530-$538. Invalidation: Close outside the $520-$548 band. (20% probability)
PRICE TARGETS
Range width check: $543.22 - $514.00 = $29.22, which is about 5.5% of $534.09. That fits a 4-day window (between the 2-4% guide for 2-3 days and the 4-8% guide for 7-10 days) and is consistent with ATR of $13.54.
- Target Price: $527.00 (4 days)
- Expected Range: $514.00 to $543.00
- Key Levels: Support at $525.00, Resistance at $543.22
OVERALL BIAS
OVERALL BIAS: BEARISH - The bearish MACD crossover, the unfilled gap-down after a high-volume blow-off spike, and price sitting below the EMA 13 and SMA 50 outweigh the marginally positive CMF and the hold at EMA 34/VWAP. Expect a modest drift lower toward $527 with $525 as the key level.
This is educational analysis and not financial advice.