SPY 5-day bullish forecast — Nov 15, 2026
- Bias: Bullish
- Timeframe: 5 days (made Nov 15, 2026, target date Nov 20, 2026)
- Price at analysis: $754.25
- Price target: $758.00
- Expected range: $740.00 – $769.00
- Result: Pending — graded after the close on Nov 20, 2026
Get a free AI analysis of SPY today
Analysis
TECHNICAL INDICATORS
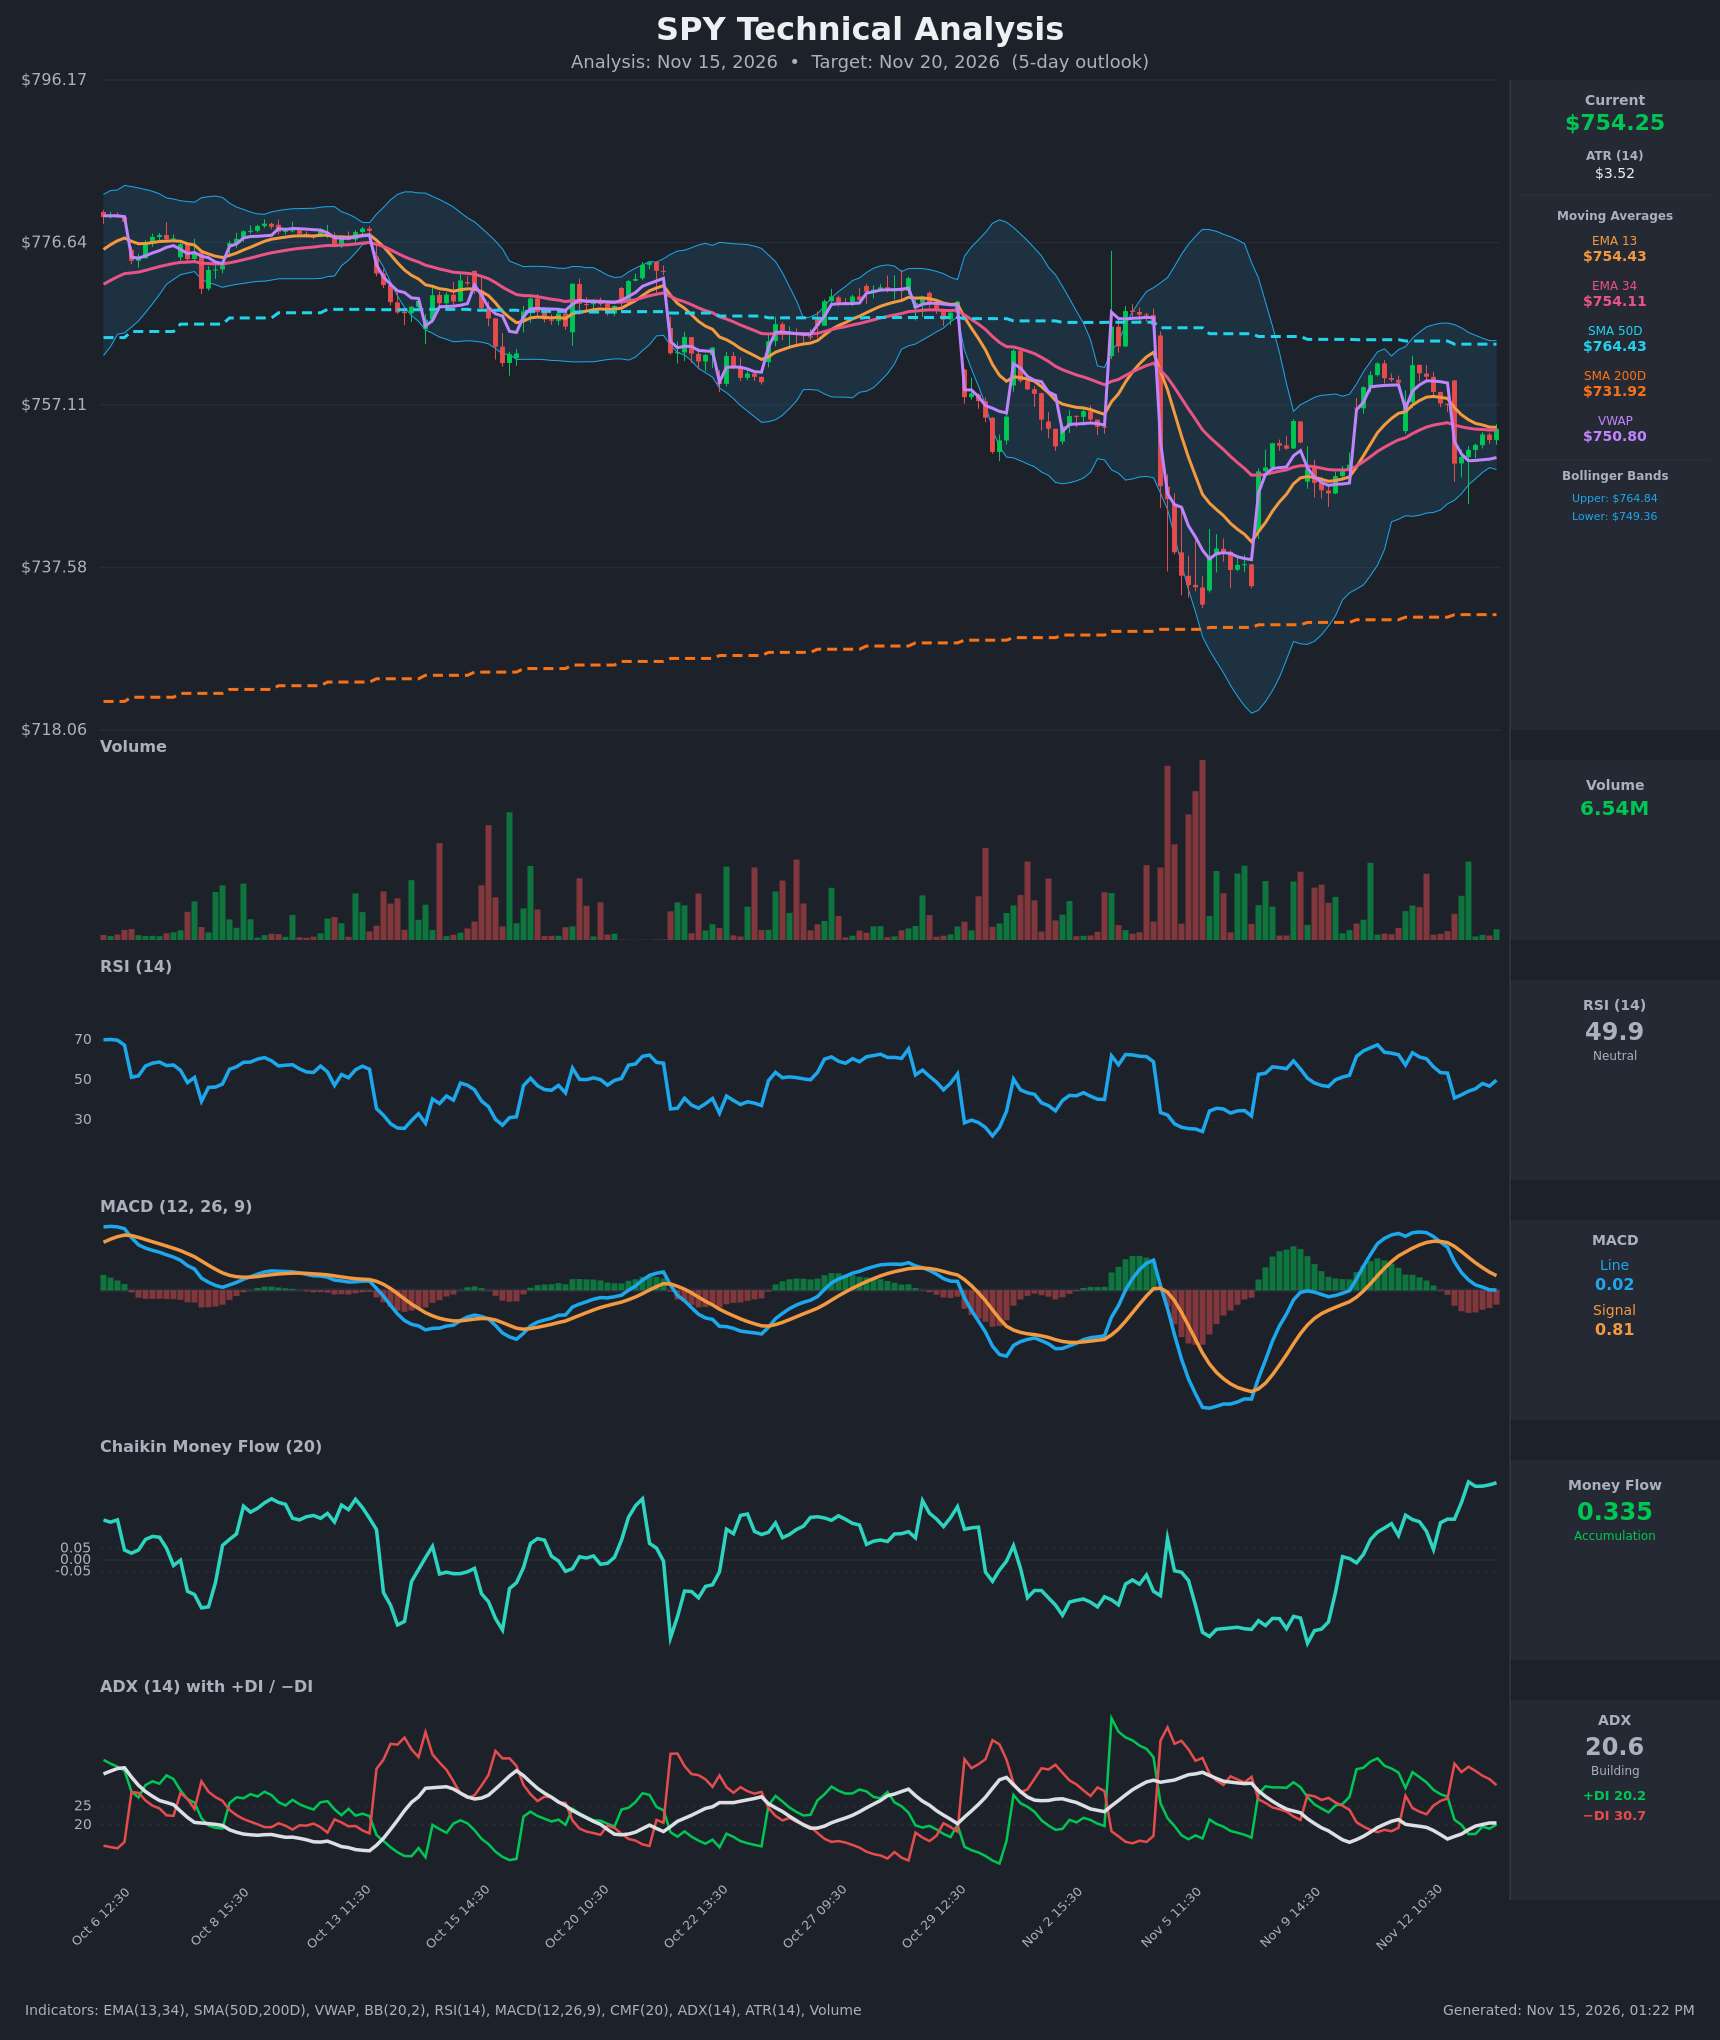
- RSI (14): 49.89, dead neutral. It dropped from 63.6 on Nov 12 to a low of 41.0 on Nov 13 and has recovered to about 50. Momentum is stabilizing, not extended in either direction. [Neutral]
- 20 EMA (EMA 13 / EMA 34 supplied): EMA 13 is $754.43 and EMA 34 is $754.11. Price at $754.25 sits between them, and the EMAs are nearly flat and converging after EMA 13 rolled over from $758. There is no clear support or resistance here. [Neutral]
- MACD: The line is 0.016 and the signal is 0.813, so the histogram is about -0.80. The bearish cross happened Nov 12 at 14:30. The histogram has narrowed from a trough of about -1.26, so downside momentum is fading. The line is at zero, so a re-cross needs a small upswing. [Neutral]
- Bollinger Bands (20): The bands are $749.36 to $764.84, with the midline near $757.10. Price is in the lower half, about 32% of the band width above the lower band. The bands are wide after the early-November selloff, so there is no squeeze. The lower band at about $749.4 lines up with the recent low of $750.07. [Neutral]
- CMF (20): 0.335, well above +0.05 and the highest reading on the chart. Price has been chopping while money flow rose, which points to accumulation and dip buying. [Accumulation]
- ADX (14): 20.6, just above the 20 line, with −DI (30.7) above +DI (20.2). Trend strength is weak and only now building. The DI spread favors sellers, but −DI has been fading since its Nov 13 peak of about 36. [Weak Trend, Bearish lean]
- Volume: 6.54M, below the heavy-volume spikes seen around the Nov 5-6 capitulation. Volume has dried up on the rebound, so there is no strong conviction either way. [Neutral / Low participation]
Other context: price is above VWAP ($750.80), which is mildly bullish. It is below the SMA50 ($764.43), which is overhead resistance, and well above the rising SMA200 ($731.92), so the long-term uptrend is intact.
DIVERGENCES & TRENDS
- Bullish CMF divergence: CMF is making new highs near 0.335 while price is still below its early-November levels and the SMA50. This suggests accumulation under the surface.
- MACD histogram: It is contracting from -1.26 to -0.80, so bearish momentum is decaying. A cross back above the signal would be an early bullish trigger.
- DI structure: −DI is above +DI, but the gap is narrowing from a 15-point lead (36.4 vs 21.4). ADX is only 20.6, so sellers are not in strong control.
- Price structure: The Nov 6 low near $735 was followed by a higher low around $750. Highs are lower than October's ($779), and price is capped by the SMA50 near $764.
- EMA 13/34: These are nearly converged. A flip below EMA 34 would be the first sign of a failed bounce.
- Death cross / golden cross: None. SMA50 is above SMA200 (a bullish structure) but the SMA50 is flat to slightly declining.
CHART PATTERNS
- Bullish Falling Wedge / Double Bottom (loose): The October-November decline into the $735 low, followed by a higher low near $750, loosely resembles a base. A neckline break above about $762 (the Nov 12 high) would target roughly $768-$772.
- Range / Rectangle: The last week shows price oscillating between about $750 and $762, which is also consistent with a short-term range. It is not clean enough to count as a Triple Top or Bottom.
- Bearish alternative: A bearish flag after the Nov 12-13 drop would need a break below $750 to confirm, targeting about $741-$745.
POTENTIAL SCENARIOS
- Scenario 1: Bullish Mean-Reversion Grind Higher — CMF accumulation, price above VWAP, and a narrowing MACD histogram support a push back toward the Bollinger midline and the upper end of the range. Trigger: hold above $750 and reclaim $757-$758, with a MACD re-cross above the signal. Target: $758-$764. Invalidation: close below $750. (45% probability)
- Scenario 2: Bearish Failed Bounce — −DI dominance and the MACD bearish cross lead to a lower high, followed by a break below VWAP and the recent low. Trigger: break and close below $750 with EMA 13 rolling under EMA 34. Target: $741-$745, with the lower band at about $749 then $737. Invalidation: reclaim of $757. (30% probability)
- Scenario 3: Neutral Range Chop — Weak ADX keeps price between $750 and $760 with no resolution. Trigger: low volume and flat EMAs. Target: $751-$760. Invalidation: a close outside the $748-$763 band. (25% probability)
PRICE TARGETS
Self-check: the range is $740.00 to $769.00, a $29.00 width, or about 3.8% of $754.25. That fits the 5-day guidance (between the 2-3 day and 7-10 day ranges).
- Target Price: $758.00 (5 trading days, around Nov 20)
- Expected Range: $740.00 to $769.00
- Key Levels: Support at $750.00, Resistance at $764.50
OVERALL BIAS
OVERALL BIAS: BULLISH - CMF accumulation at 0.335, price above VWAP, and a narrowing MACD histogram favor a modest rebound toward the $757-$764 area. The conviction is limited because −DI is above +DI, price is below the SMA50, and ADX is weak.
This is educational analysis and not financial advice.