IBIT 4-day bearish forecast — Nov 15, 2026
- Bias: Bearish
- Timeframe: 4 days (made Nov 15, 2026, target date Nov 18, 2026)
- Price at analysis: $38.95
- Price target: $38.45
- Expected range: $37.50 – $39.40
- Result: Pending — graded after the close on Nov 18, 2026
Get a free AI analysis of IBIT today
Analysis
TECHNICAL INDICATORS
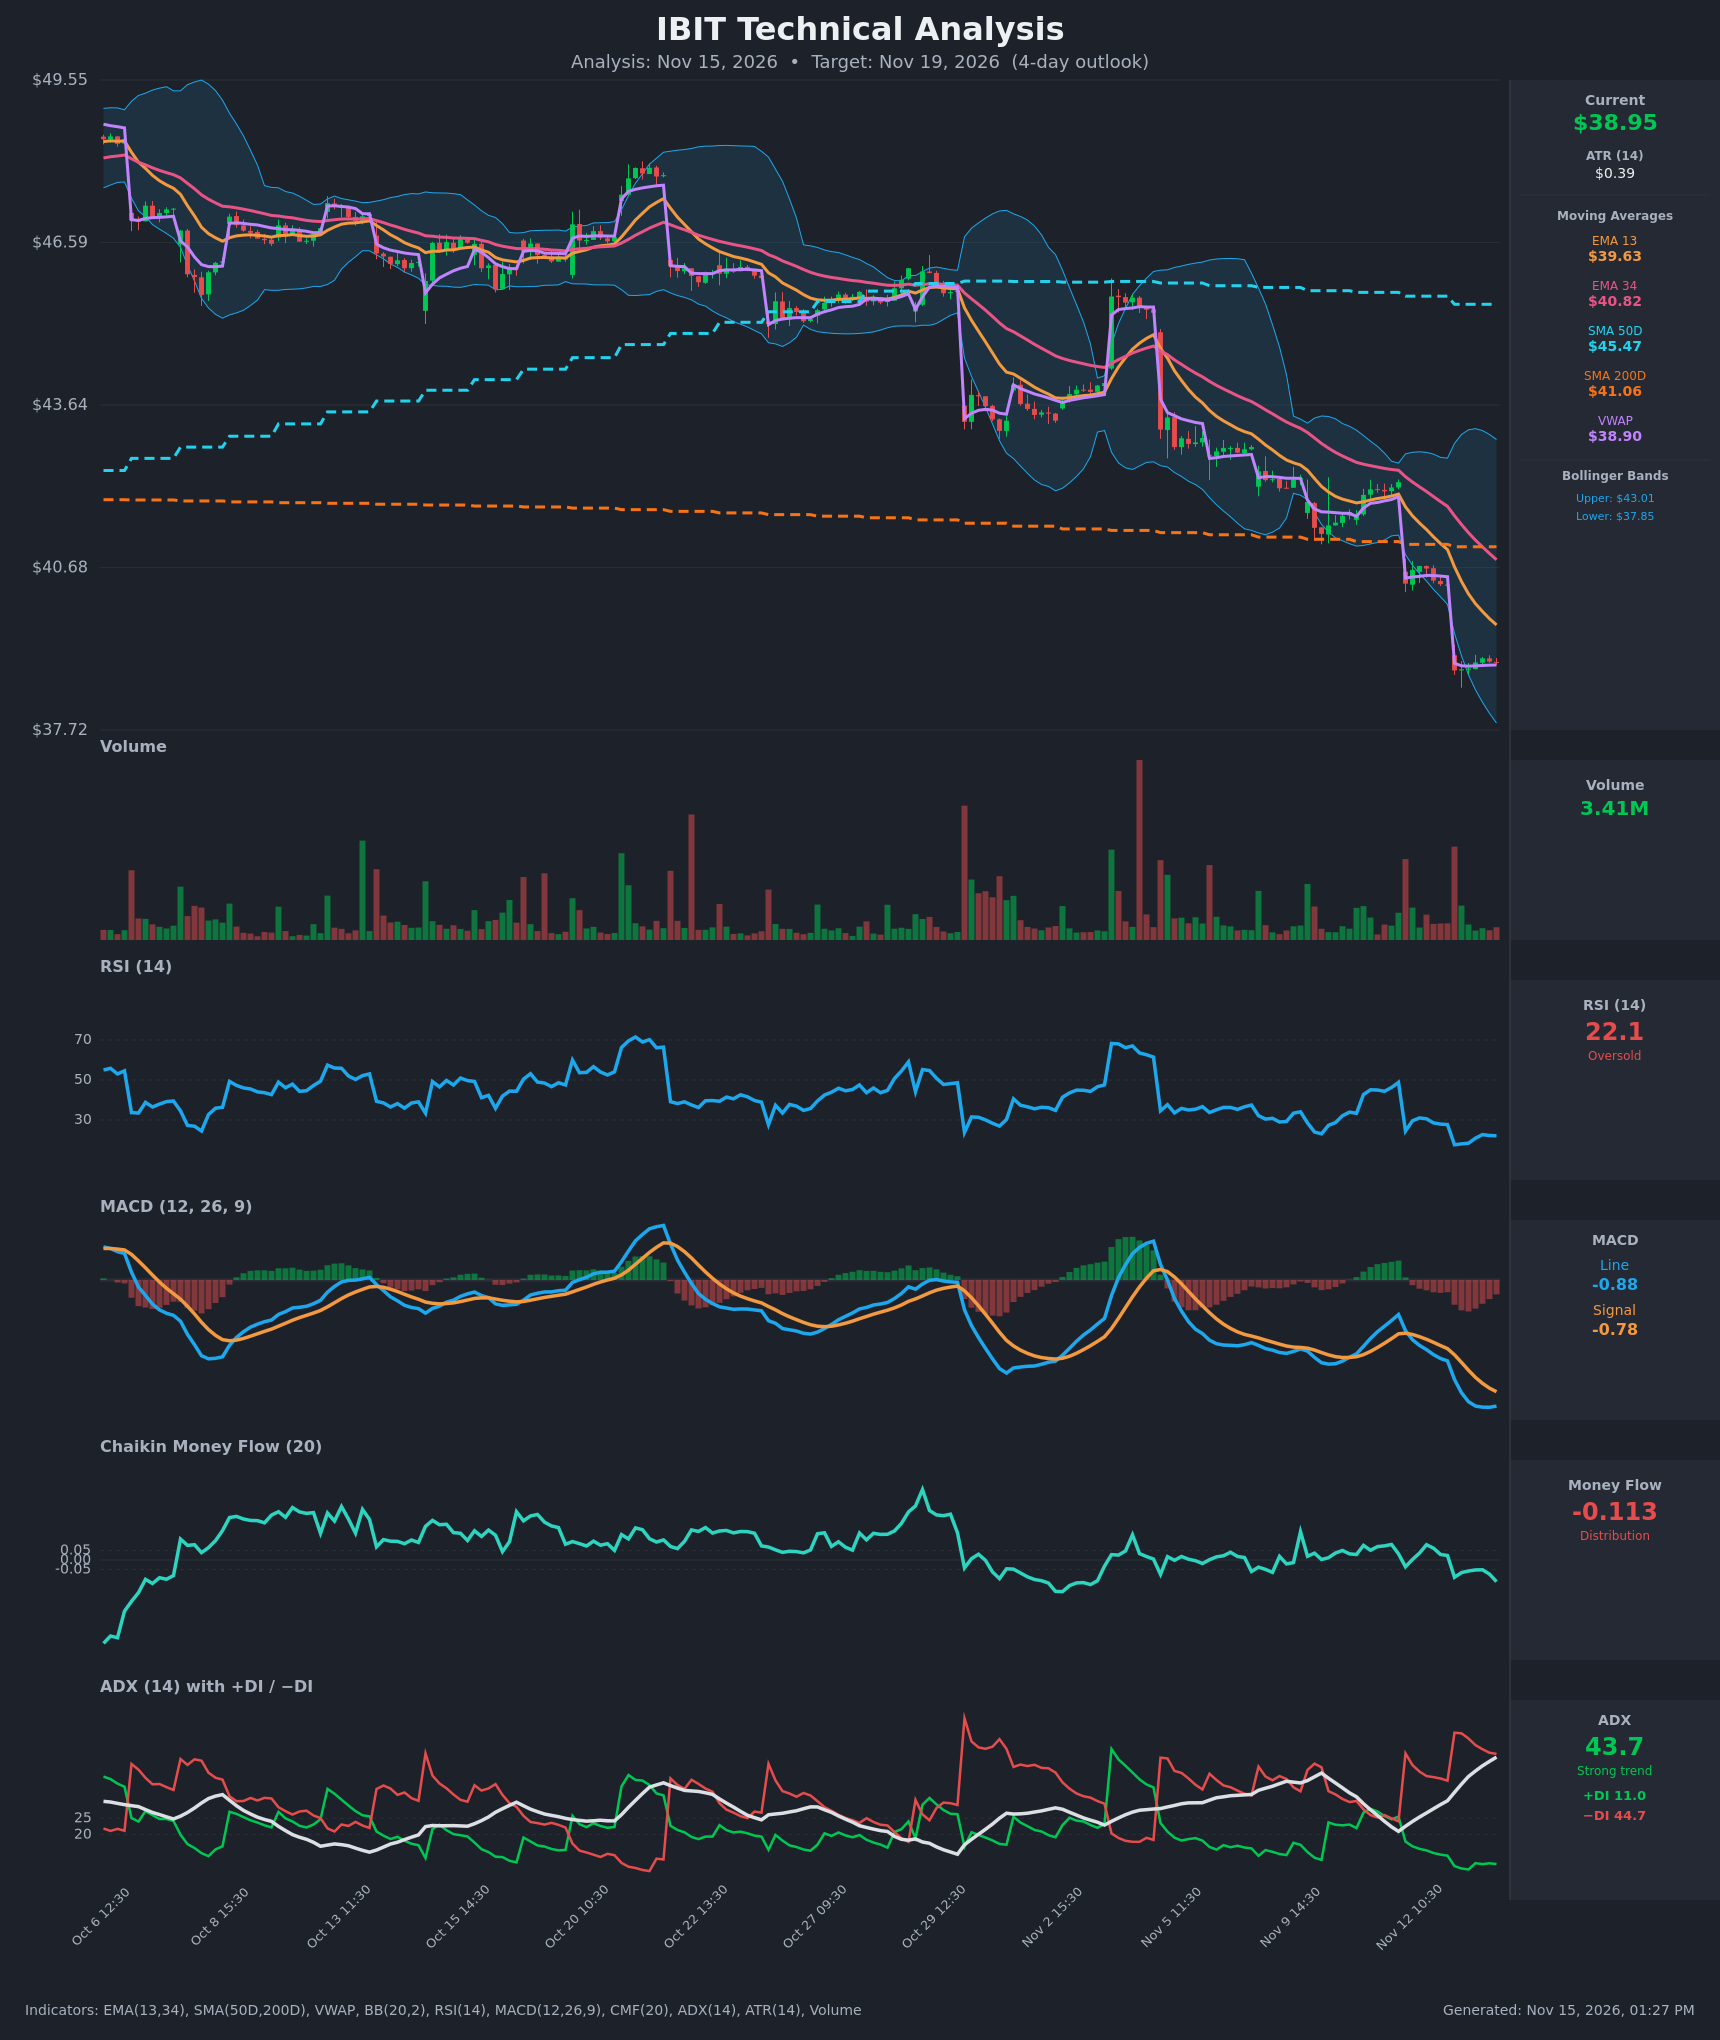
- RSI (14): 22.10, deeply oversold. It fell from 48.8 on Nov 11 to 17.6 on Nov 13, then bounced only slightly to the low 20s. Momentum is still pinned at the bottom, with no bullish divergence yet. [Bearish] (oversold, so a bounce is possible, but there is no reversal signal)
- 20 EMA: The data gives EMA 13 at $39.63 and EMA 34 at $40.82. Price at $38.95 is below both, and both are sloping down steeply. EMA13 is below EMA34, a bearish alignment that widened through the last 15 bars. The EMAs are overhead resistance, with EMA13 the nearest. [Bearish]
- MACD: Line -0.879 is below the signal at -0.778, and both are negative. The line crossed below the signal around Nov 12 and has stayed below it. The line has flattened at -0.886 in the last few bars, so downside momentum is stalling rather than accelerating. The histogram is negative. [Bearish]
- Bollinger Bands (20): Upper $43.01, lower $37.85. Price at $38.95 sits in the lower quarter of the bands, which have expanded sharply. After walking the lower band in a gap-driven decline, price is hugging it. The lower band at $37.85 is the next downside reference. [Bearish]
- CMF (20): -0.113, below the -0.05 threshold and falling again after a brief flicker toward neutral. Sustained distribution since late October. [Distribution]
- ADX (14): 43.7 and rising steadily from 21 on Nov 11. −DI is 44.7 and +DI is 11.0. A very strong downtrend with bears firmly in control. ADX above 40 also means the trend is mature and prone to exhaustion. [Strong Trend - Bearish]
- Volume: 3.41M on the latest bar, which is modest relative to the heavy sell-off volume spikes earlier in the month. Selling pressure on the final bars has faded, but there is no capitulation spike or buying surge to signal a bottom. VWAP at $38.90 is almost exactly at price, so the market has been flat around fair value since the gap. [Neutral to slightly bearish, with no capitulation volume]
DIVERGENCES & TRENDS
- There is no bullish RSI or MACD divergence. RSI made a new low (17.6) when price made a new low, which is confirmation, not divergence. RSI has since climbed to about 22 while price held flat, which is early, minor stabilization.
- The MACD line is flattening (-0.886 to -0.879) while still below its signal. A bullish cross would need several more flat or up bars, so it is unlikely within 4 days without a bounce.
- EMA13 is below EMA34, and both are below the SMA200D ($41.06) and SMA50D ($45.47). The SMA50D remains well above the SMA200D, so there is no death cross yet. Price has broken below the SMA200D, which is a major long-term bearish break.
- The decline is happening as stair-step gap-downs at the open (Nov 12 and Nov 13 at 09:30). Each gap was followed by flat intraday consolidation, so the selling is driven by overnight and opening moves.
- ADX is above 40 and rising with −DI above 44. This is typically a late-stage trend, which raises the odds of a relief bounce, but it is not a reversal signal on its own.
CHART PATTERNS
- The closest reference pattern is a Bearish Flag/Pennant (continuation). After the sharp gap-down legs, price has traded in a tight horizontal range around $38.80-$39.03. A break below $38.80 would project a further measured move toward the $37.85 lower band and possibly $37.70, the bottom of the visible chart.
- A wider, descending channel has persisted since late October, with lower highs and lower lows.
- No reversal pattern (double bottom, falling wedge, or inverted head and shoulders) has formed. A bounce would be only a relief rally toward the EMA13 at $39.63, which would be rejected unless price reclaims it.
POTENTIAL SCENARIOS
- Scenario 1: Bearish Trend Continuation — The tight consolidation resolves lower, continuing the pattern of gap-downs followed by flat trading. ADX above 40 and −DI dominance favor this. Trigger: break below $38.80 (the Nov 13 low area) and loss of VWAP at $38.90. Target: $38.20-$37.85 (lower Bollinger Band). Invalidation: a close above the EMA13 at $39.63. (50% probability)
- Scenario 2: Neutral Oversold Consolidation — RSI at 22 limits the downside and price chops between the lower band and VWAP. Trigger: holds $38.50-$39.30 with fading volume. Target: $38.80-$39.20. Invalidation: a break below $38.30 or above $39.65. (22% probability)
- Scenario 3: Bullish Relief Bounce — A mean-reversion rally from an extreme oversold reading. Trigger: reclaim of $39.30 on rising volume and a flattening MACD. Target: $39.60-$40.00 (EMA13, then the gap area). Invalidation: failure at the EMA13 and a break below $38.70. (28% probability)
PRICE TARGETS
- Target Price: $38.45 (4-day horizon, about -1.3% from current)
- Expected Range: $37.50 to $39.40 (width $1.90, about 4.9% of current price, in line with a 4-day horizon)
- Key Levels: Support at $37.85 (lower Bollinger Band), Resistance at $39.63 (EMA13)
OVERALL BIAS
OVERALL BIAS: BEARISH - ADX is above 43 with −DI far above +DI, price is below all key moving averages including the SMA200D, and MACD and CMF both confirm selling pressure. Extreme oversold RSI raises the risk of a relief bounce, so conviction is modest and the expected move is small.
This is educational analysis and not financial advice.