IBIT 6-day bearish forecast — Nov 15, 2026
- Bias: Bearish
- Timeframe: 6 days (made Nov 15, 2026, target date Nov 20, 2026)
- Price at analysis: $38.95
- Price target: $38.35
- Expected range: $37.45 – $39.65
- Result: Pending — graded after the close on Nov 20, 2026
Get a free AI analysis of IBIT today
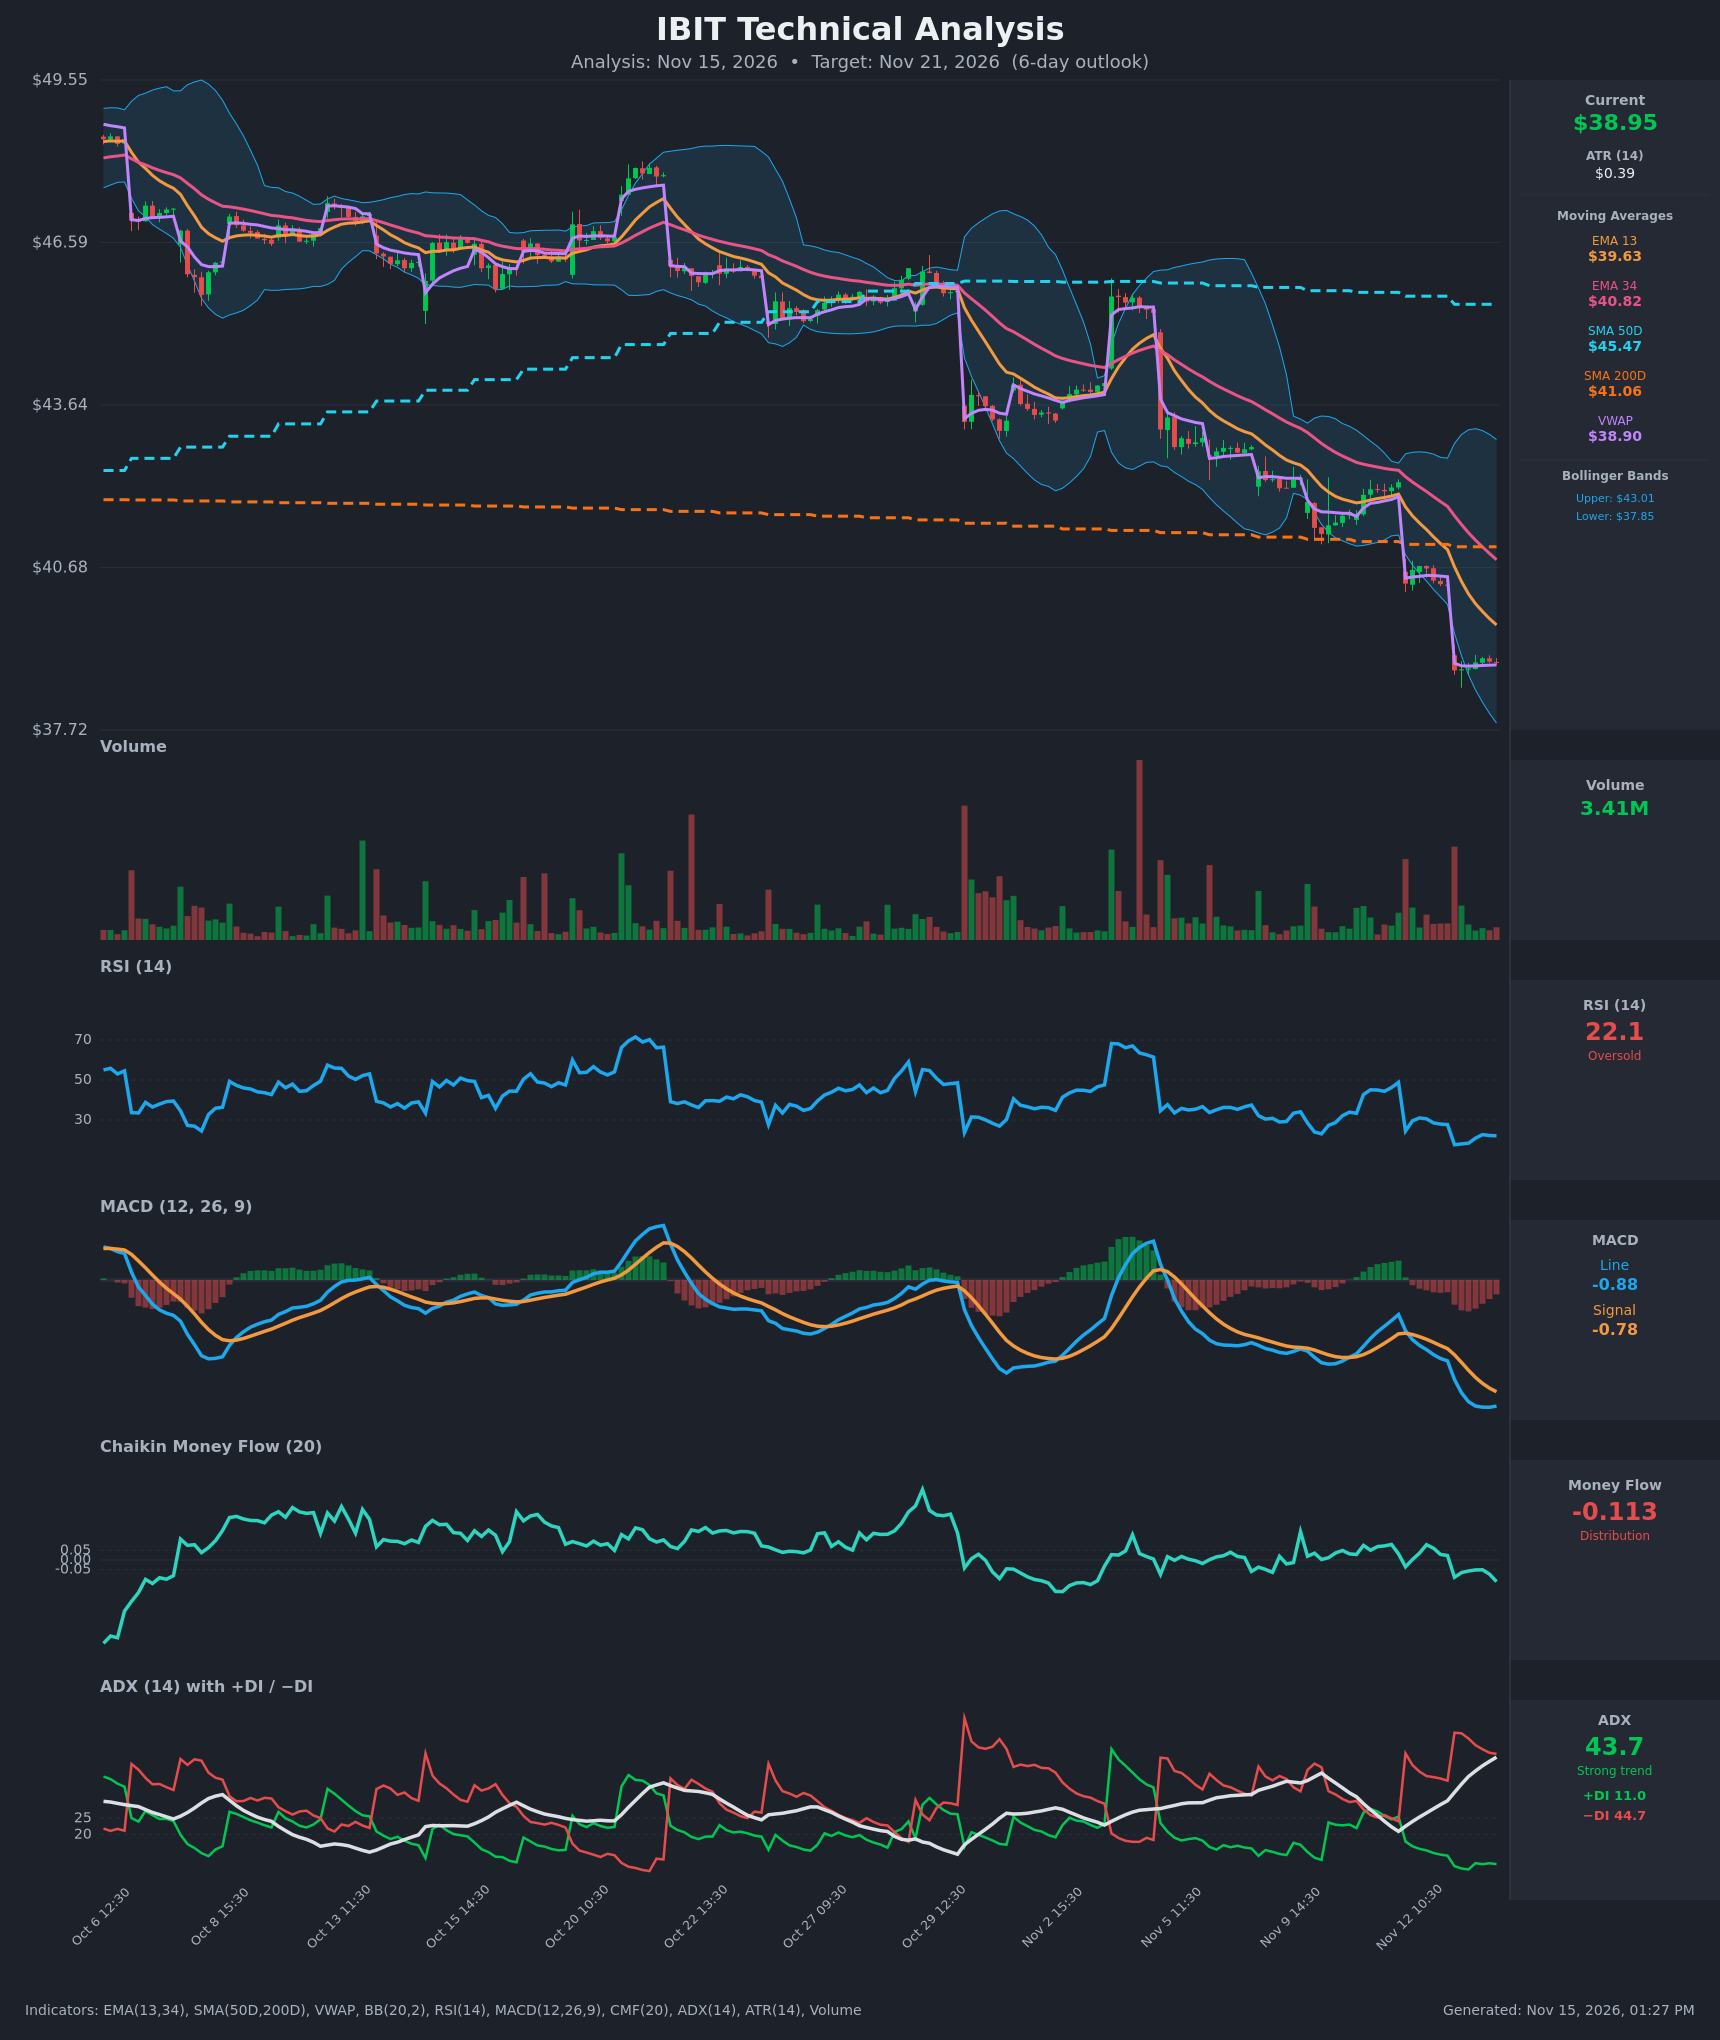
Analysis
TECHNICAL INDICATORS
- RSI (14): 22.10, deep in oversold territory. It bottomed at 17.6 on the Nov 13 gap down and has only edged up to 22 while price went flat. Oversold readings in a strong trend can persist, and there is no bullish divergence yet. [Bearish]
- 20 EMA: The chart uses EMA 13 ($39.63) and EMA 34 ($40.82). Price at $38.95 is below both, and EMA13 is below EMA34, so both act as overhead resistance. Both are sloping down steeply. [Bearish]
- MACD: Line -0.879, signal -0.778, histogram about -0.10. The line crossed below the signal around Nov 12-13 and both sit well below zero. The line has flattened (-0.886 to -0.879) and the histogram gap is narrowing, an early sign that downside momentum is slowing but not reversing. [Bearish]
- Bollinger Bands (20): Upper $43.01, lower $37.85, with the bands widening sharply on the sell-off. Price at $38.95 sits in the lower quarter of the bands, about $1.10 above the lower band, after riding the lower band during the gap. The expansion confirms a volatility-driven downtrend, though a mean-reversion bounce is possible. [Bearish]
- CMF (20): -0.113, below the -0.05 threshold and falling again after a brief recovery. This points to persistent distribution and selling pressure. [Distribution]
- ADX (14): 43.7 and rising, with −DI at 44.7 far above +DI at 11.0. This is a strong, mature bearish trend. A reading above 40 can mean the trend is stretched, but there is no sign of a DI crossover. [Strong Trend – Bearish]
- Volume: 3.41M, modest and below the spikes seen on earlier sell-off days. The latest bars show light volume during the tight consolidation after the gap. This suggests no capitulation yet, and no strong buyer interest either. [Neutral to Mildly Bearish]
- Other levels: VWAP is $38.90, and price is hugging it (just above), so it is a pivot level. SMA50D ($45.47) is falling toward SMA200D ($41.06) and price is below both. The long-term structure is bearish and a death cross is approaching. [Bearish]
DIVERGENCES & TRENDS
- There is no confirmed bullish divergence. RSI ticked up from 17.6 to 22 while price held flat around $38.80-$39.05, which is a minor sign of selling exhaustion, not a signal.
- The MACD histogram is shrinking in magnitude, but the line is still declining and below the signal.
- There is a staircase pattern of gap-downs, at Oct 29, Nov 5 to 9, Nov 12 and Nov 13, each followed by a weak bounce that fails below the EMAs.
- EMA13 is below EMA34, and price is below the SMA200D ($41.06) and SMA50D ($45.47). The SMA50D is rolling over toward the SMA200D, so a death cross is likely if the decline continues.
- ADX is rising with −DI dominant, and CMF has turned back down. Trend and money-flow evidence agree on the downside.
CHART PATTERNS
- Bearish Pennant / Flag (continuation): After the sharp drop to $38.80, price has been stalling in a very tight range of $38.80-$39.05. This resembles the Bearish Pennant/Flag from the reference diagram. A break below $38.80 targets roughly $37.80-$37.90, a measured move near the lower Bollinger Band, with possible extension toward $37.40.
- Larger structure: The sequence of lower highs and lower lows since early October is a descending channel with stair-step gap-downs. It is a trend-continuation structure, not a reversal, because no double bottom or inverted head-and-shoulders has formed.
- Counter-risk: An RSI near 22 with price at the lower band can produce a relief bounce, typically toward the EMA13 near $39.60.
POTENTIAL SCENARIOS
- Scenario 1: Bearish Trend Continuation — The pennant-like consolidation breaks lower, and the strong ADX/−DI trend, distribution in CMF and the negative MACD drive price toward the lower Bollinger Band. Trigger: a close below $38.80 with rising volume. Target: $37.85-$38.30, with an extension to $37.50. Invalidation: a close above $39.65 (EMA13). (55% probability)
- Scenario 2: Bullish Oversold Relief Bounce — RSI near 22 and a narrowing MACD histogram prompt short covering, and price reverts toward the EMA13. Trigger: a push above VWAP and $39.10 on improving volume. Target: $39.60-$40.30. Invalidation: rejection at the EMA13 and a close back below $38.80. (30% probability)
- Scenario 3: Neutral Choppy Base — Price drifts in the $38.50-$39.50 zone as the sell-off pauses. Trigger: low-volume, narrow-range days around VWAP. Target: $38.90-$39.10. Invalidation: a close beyond either $38.30 or $39.65. (15% probability)
PRICE TARGETS
For the 6-day horizon (range width about $2.20, or roughly 5.6% of the current price, consistent with the 4-8% guideline):
- Target Price: $38.35
- Expected Range: $37.45 to $39.65
- Key Levels: Support at $37.85 (lower Bollinger Band), Resistance at $39.63 (EMA13)
OVERALL BIAS
OVERALL BIAS: BEARISH - ADX at 43.7 with −DI far above +DI, a negative MACD below its signal, distribution in CMF, and price below all the key moving averages favour continuation lower. The oversold RSI limits the downside, so conviction is moderate and a bounce toward $39.60 is the main risk.
This is educational analysis and not financial advice.