SOFI 4-day bearish forecast — Nov 15, 2026
- Bias: Bearish
- Timeframe: 4 days (made Nov 15, 2026, target date Nov 18, 2026)
- Price at analysis: $15.43
- Price target: $15.20
- Expected range: $14.75 – $15.75
- Result: Pending — graded after the close on Nov 18, 2026
Get a free AI analysis of SOFI today
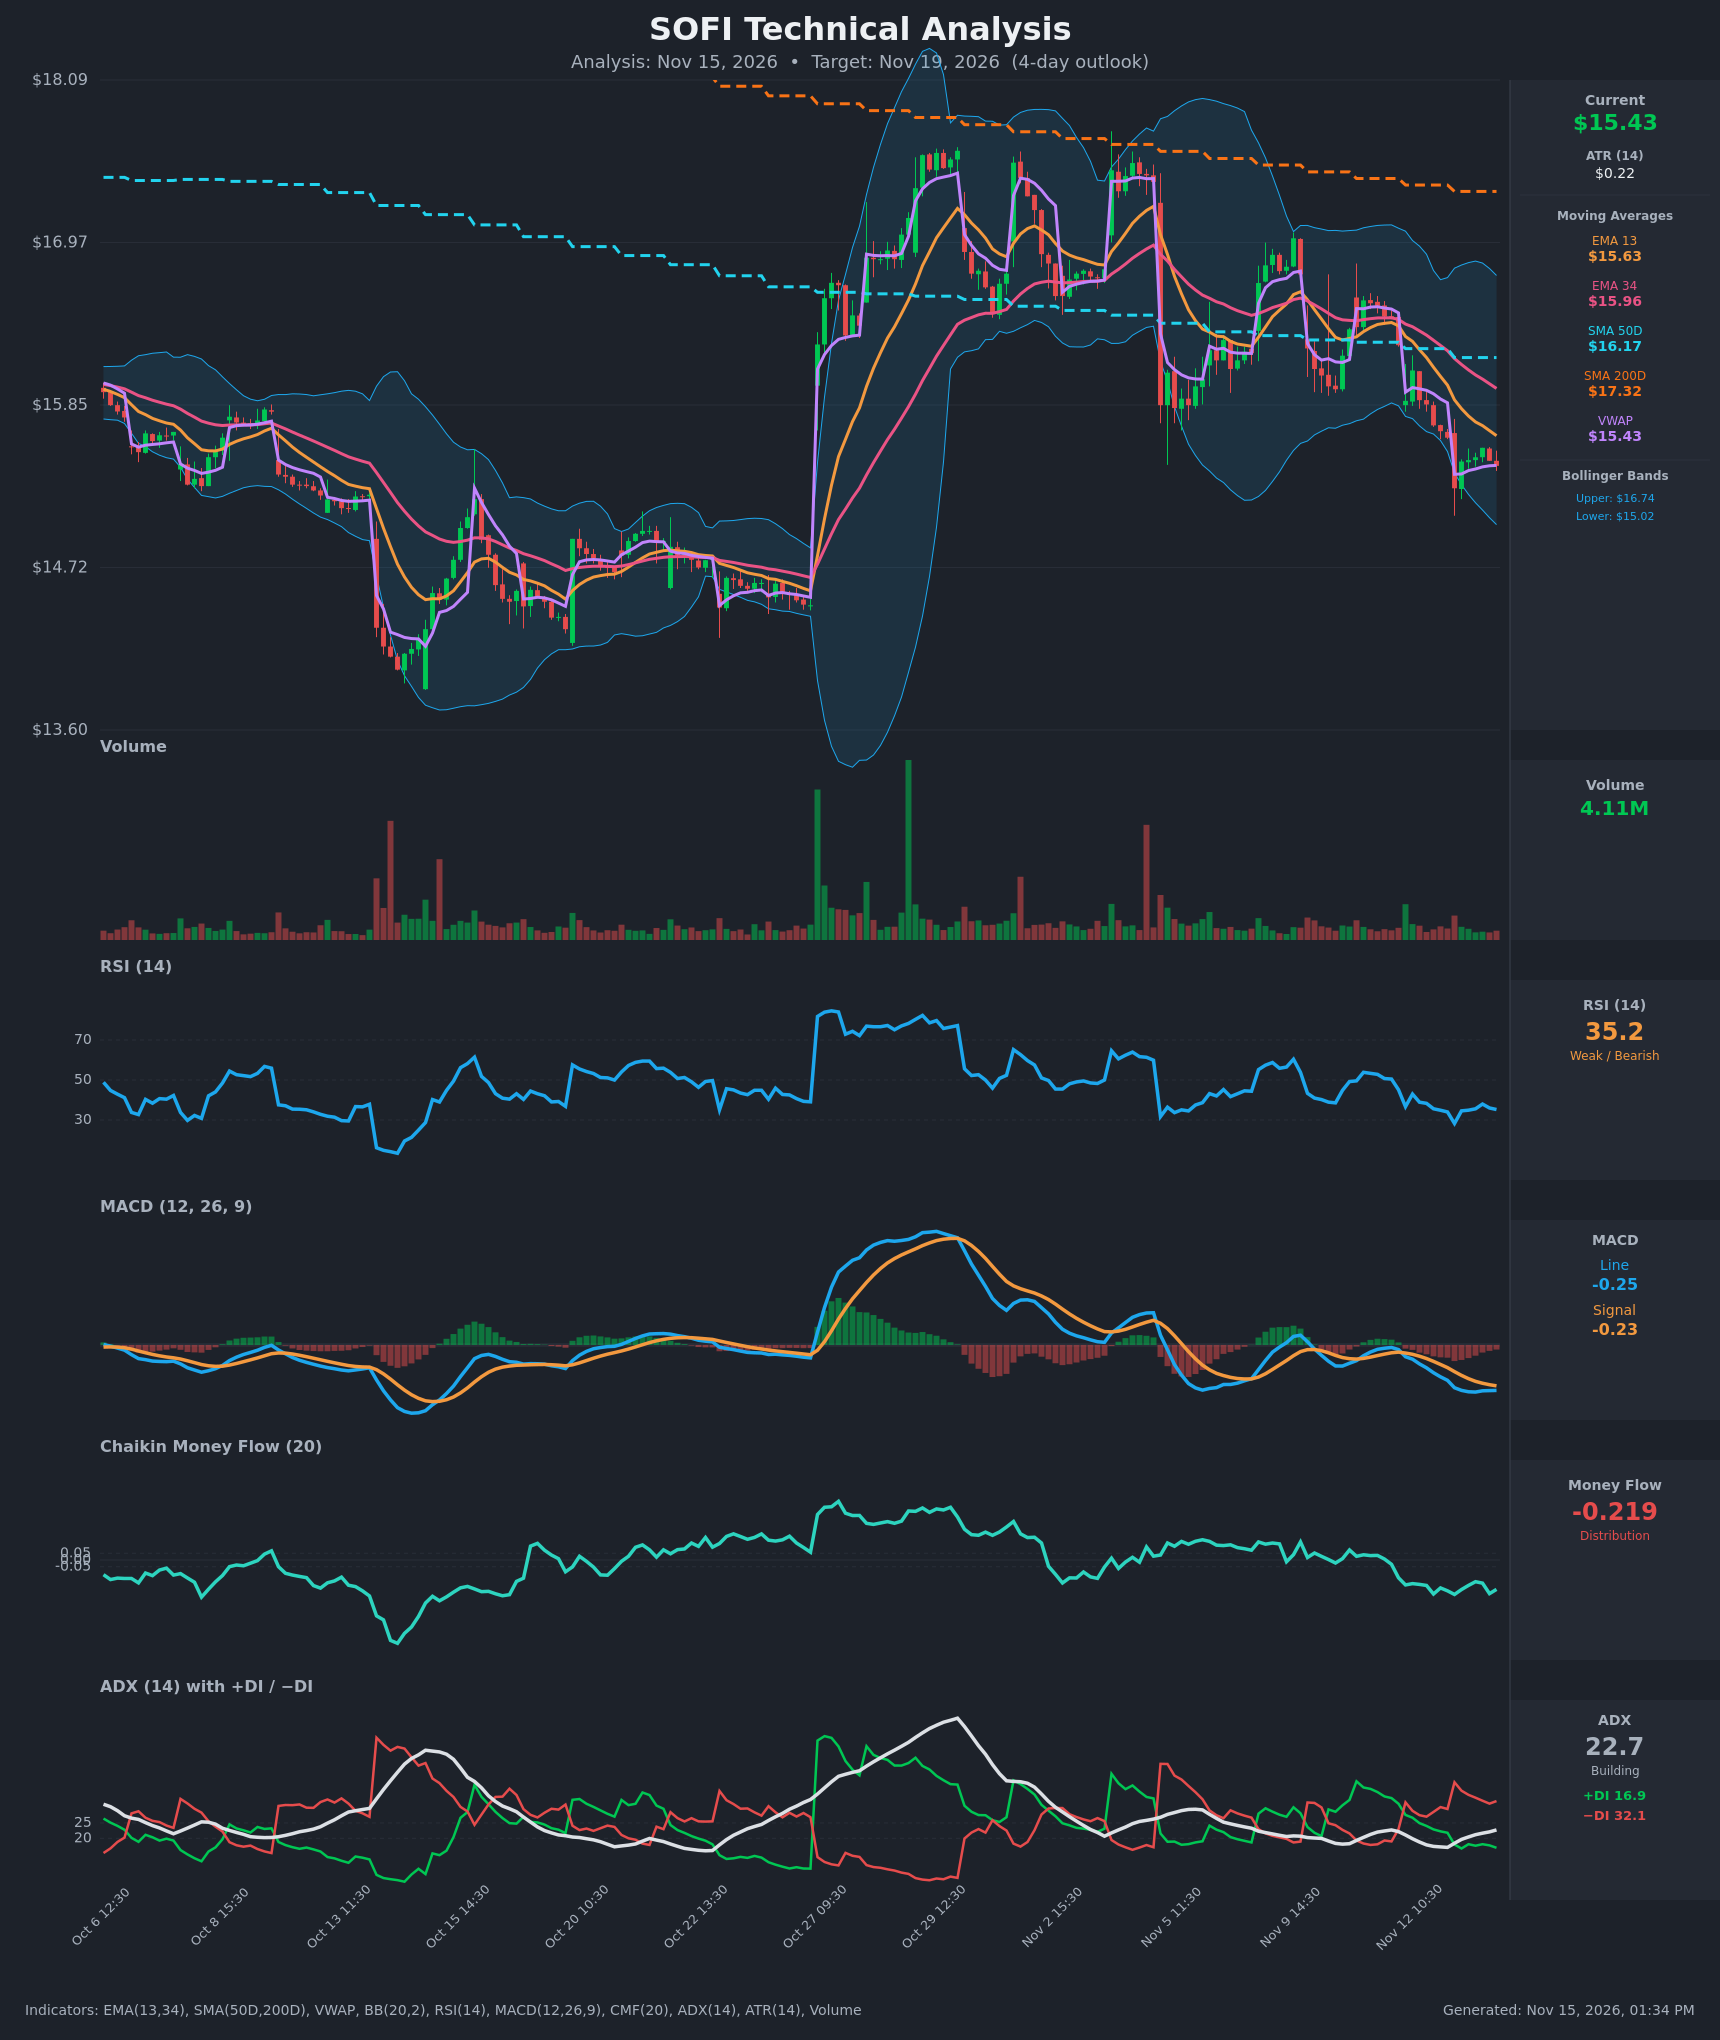
Analysis
TECHNICAL INDICATORS
- RSI (14): 35.24, near oversold (<30) but not there yet. It has been falling since the Nov 11 reading of 45 and bottomed at 28.3 on Nov 13 at the open. The bounce since then has been weak, with no bullish momentum shift. [Bearish]
- EMA 13 / EMA 34: EMA13 is $15.63 and EMA34 is $15.96. Price at $15.43 is below both, and EMA13 is below EMA34, a bearish alignment that has held since Nov 12. Both averages slope down and act as overhead resistance. [Bearish]
- MACD: The line is -0.2506 and the signal is -0.2254, so the line is below the signal. The histogram is slightly negative at about -0.025. The line has been flat to slightly rising against the signal over the last few bars (-0.260 → -0.251), so downward momentum is stalling, but there is no bullish crossover. [Bearish]
- Bollinger Bands (20): Upper $16.74, lower $15.02, mid ~$15.88. Price at $15.43 sits in the lower third, about 0.4 of the band width above the lower band. The bands are wide after the October volatility. There is no squeeze, and price is walking down toward the lower band. [Bearish]
- CMF (20): -0.219, well below -0.05 and in sustained distribution. It has fallen steadily from positive territory in early November. [Distribution]
- ADX (14): 22.7 and rising slowly, so a trend is building. −DI is 32.1 against +DI 16.9, so bears are firmly in control and the trend is down. [Moderate Trend, Bearish]
- Volume: 4.11M, near the low end of the recent range. The sell-offs show larger red bars (Nov 5 and Nov 13), while the recent bounce came on thin volume. Low-volume bounces tend to be weak and corrective. [Bearish, weak bounce]
DIVERGENCES & TRENDS
- No clear bullish RSI divergence: RSI made a low of 28.3 on Nov 13 while price made a low near $15.27. The subsequent price retest at $15.43 holds a higher RSI of 35, which is a mild hint of momentum stabilization but not a confirmed divergence.
- MACD: The line is below the signal and below zero. Its slope has flattened, so it could converge toward a cross, but the histogram is still negative.
- Moving averages: SMA50D ($16.17) is below SMA200D ($17.32), a death-cross configuration that is already in place. Price is below both, as well as EMA13, EMA34 and VWAP-aligned intraday levels. This is a strong downtrend structure.
- VWAP: Price ($15.43) is essentially at VWAP ($15.43), a neutral reading in itself. VWAP resets on a session basis and has trended lower, which reflects the step-down in value.
- Trend: The series of lower highs (~$17.2 → ~$16.7 → ~$16.3 → ~$15.9) and lower lows confirms a downtrend after the late-October spike.
CHART PATTERNS
- Bearish-leaning descending structure: Price has made lower highs since the early November peak while testing support around $15.2-$15.3. This resembles a Descending Triangle/bearish continuation, with horizontal support near $15.25 and lower highs pressing down on it. A break below $15.25 would project toward ~$14.7-$14.9.
- Bearish Flag-like bounce: The weak, low-volume bounce from $15.27 to about $15.55 is consistent with a flag within the downtrend.
- Alternative: a Bullish Falling Wedge is possible if the lower highs and lows converge, but there is no confirmation. RSI is near oversold, so a relief bounce toward EMA13 (~$15.63) is plausible.
- The prior base around $14.4-$14.7 acts as a measured-move area.
POTENTIAL SCENARIOS
- Scenario 1: Bearish Continuation Lower — −DI dominance, CMF distribution, and price below all key MAs favor a break of the $15.25-$15.27 support. Trigger: hourly close below $15.25 on rising volume. Target: $14.90-$15.05 (lower Bollinger Band area, ~1.5-2 ATR-days of movement). Invalidation: hourly close above EMA13 (~$15.65). (55% probability)
- Scenario 2: Neutral Chop / Oversold Consolidation — RSI is near 30 and price sits near support, so it may range between $15.20 and $15.65 while MACD flattens. Trigger: holds $15.25 with low volume. Target: $15.30-$15.55. Invalidation: close outside $15.20-$15.70. (25% probability)
- Scenario 3: Bullish Relief Bounce — A short-term oversold bounce toward EMA13/EMA34. Trigger: reclaim of $15.65 with volume expansion and MACD bullish cross. Target: $15.95 (EMA34). Invalidation: close back below $15.25. (20% probability)
PRICE TARGETS
For a 4-day horizon, the range width should be about 4-8% of price, or roughly $0.62-$1.23. I used about 6.5%, which is $1.00 on $15.425, and it is wider than a 2-3 day range. ATR of $0.22 daily implies about ±$0.45 over 4 days at 1 sigma, so the range is consistent.
- Target Price: $15.20 (a bearish drift of about 1.5% below current price)
- Expected Range: $14.75 to $15.75 (width $1.00 ≈ 6.5%)
- Key Levels: Support at $15.02 (lower Bollinger Band; the intraday low is near $15.27), Resistance at $15.63 (EMA13)
OVERALL BIAS
OVERALL BIAS: BEARISH - Price is below all key moving averages with −DI far above +DI (32.1 vs 16.9), CMF in heavy distribution (-0.219), and MACD still below its signal. A weak, low-volume bounce suggests continuation toward the lower Bollinger Band, though oversold RSI near 35 limits the downside and raises the risk of a short relief rally.
This is educational analysis and not financial advice.