SOFI 6-day bearish forecast — Nov 15, 2026
- Bias: Bearish
- Timeframe: 6 days (made Nov 15, 2026, target date Nov 20, 2026)
- Price at analysis: $15.43
- Price target: $15.10
- Expected range: $14.70 – $15.80
- Result: Pending — graded after the close on Nov 20, 2026
Get a free AI analysis of SOFI today
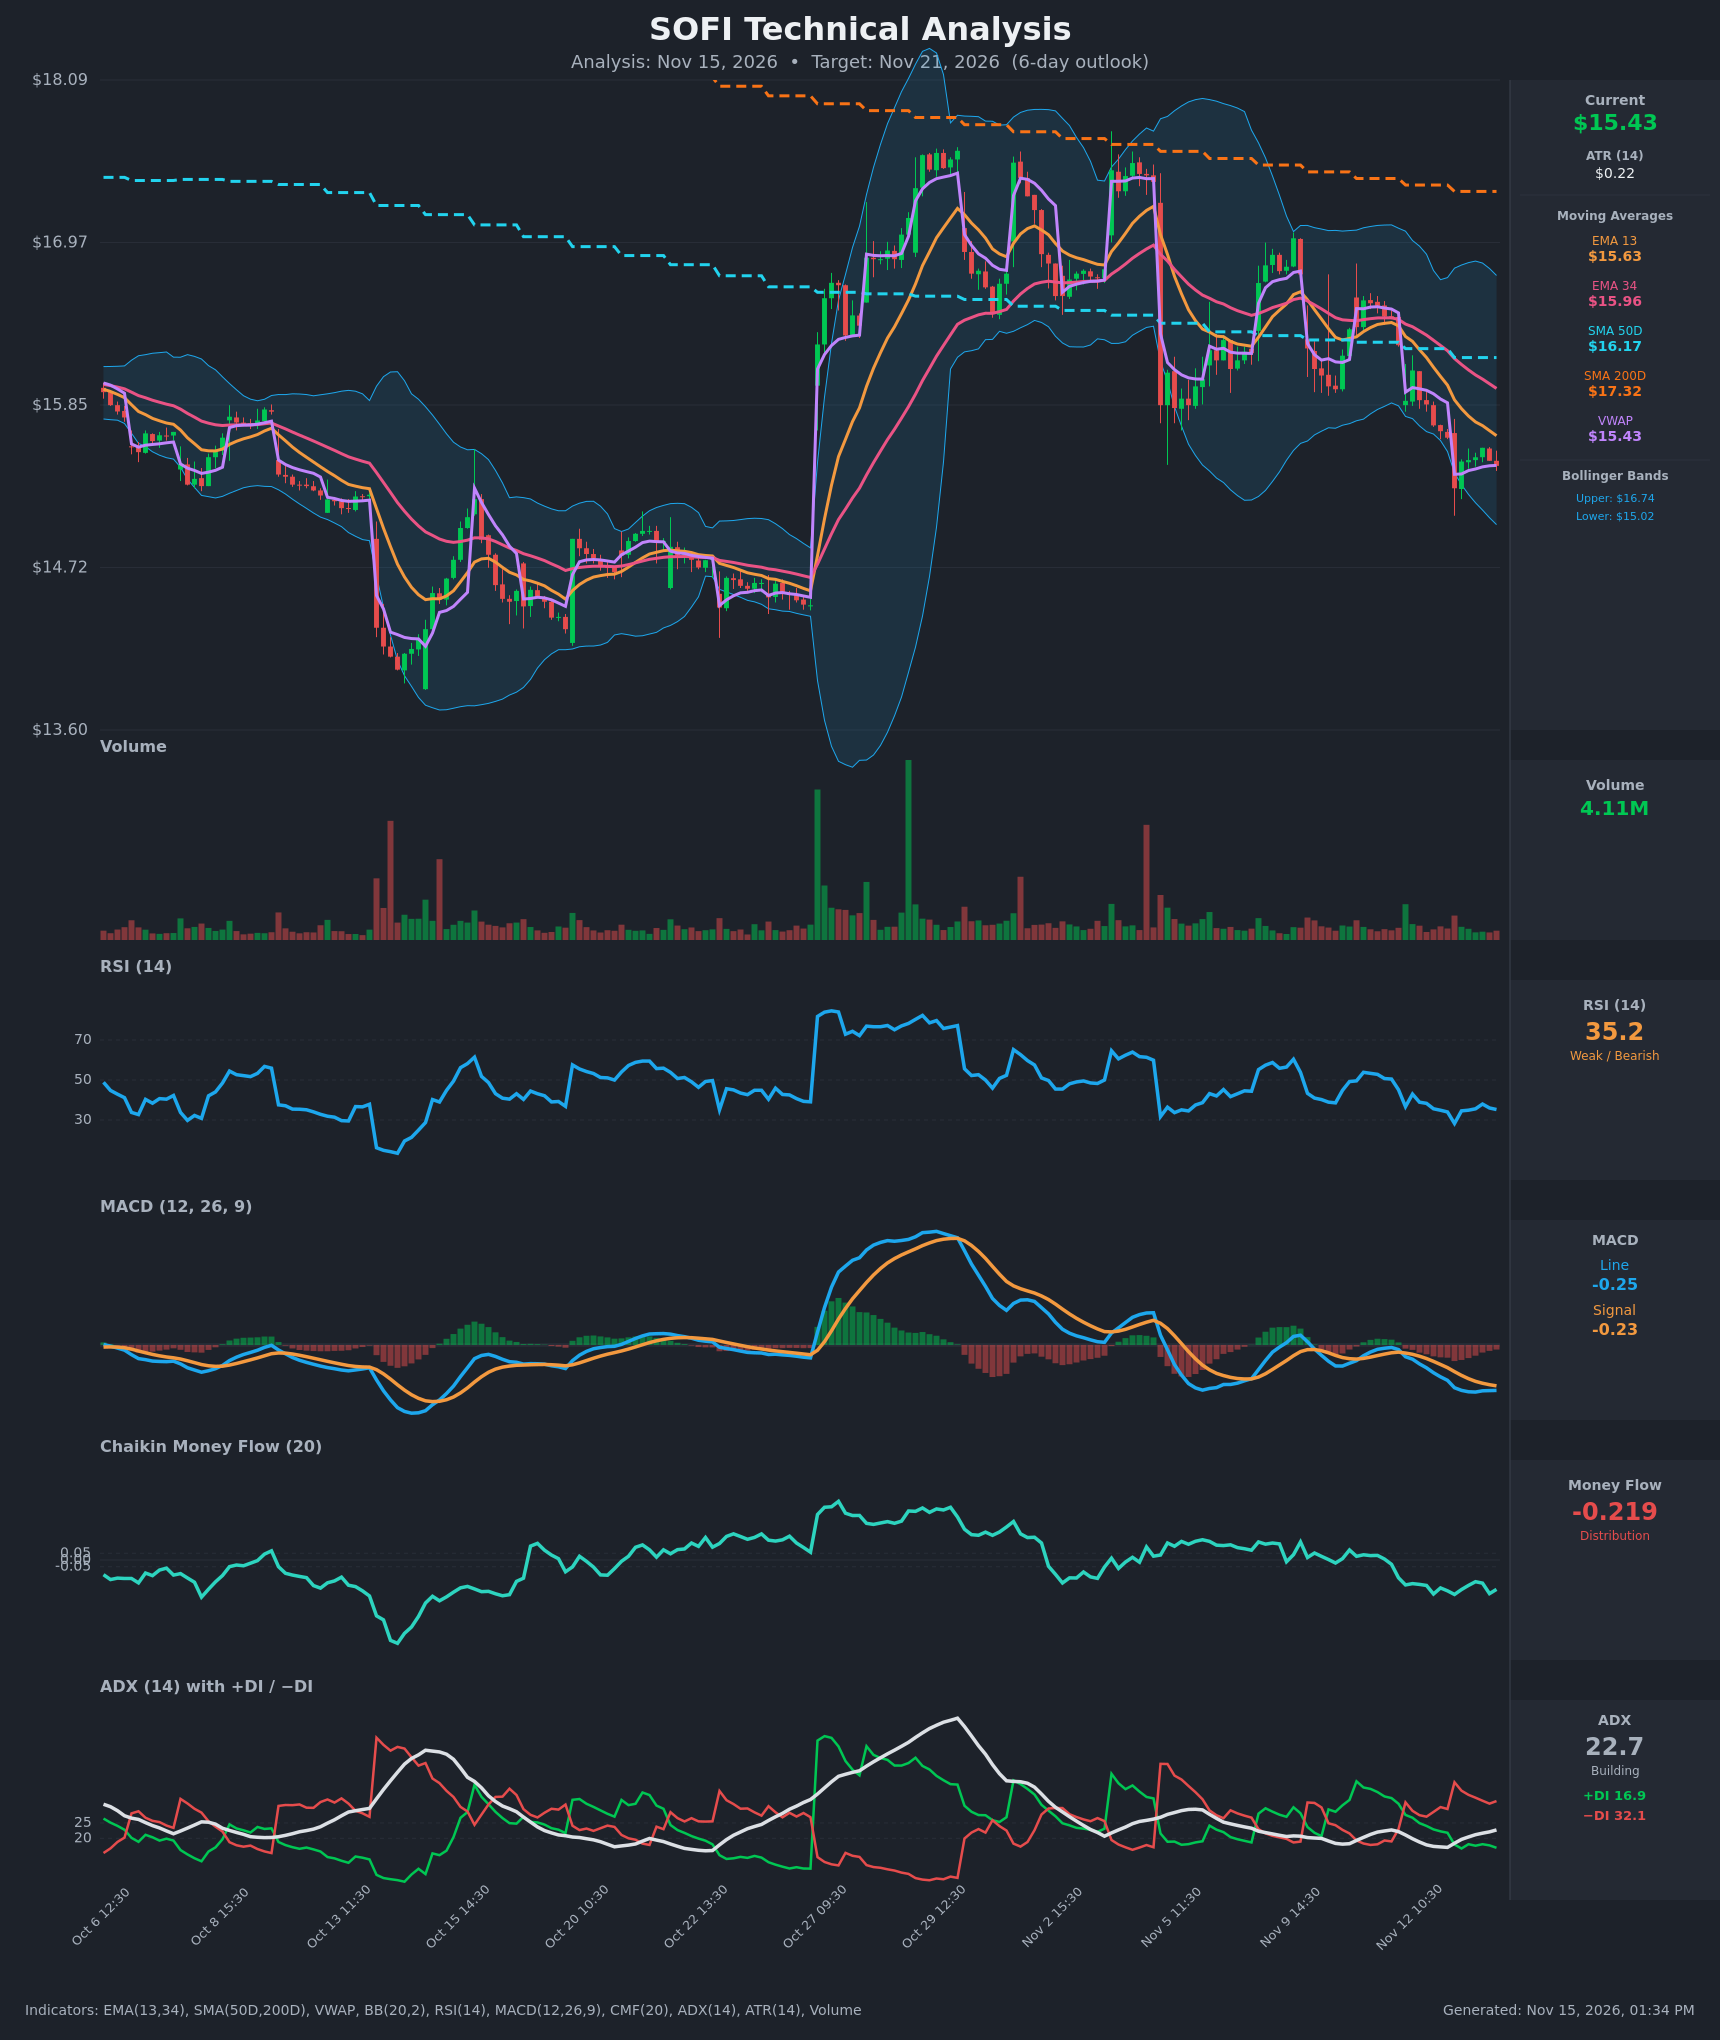
Analysis
TECHNICAL INDICATORS
- RSI (14): 35.24, near the oversold line but not yet below 30. It dropped from 45 to 28 on Nov 13 and has only bounced to the mid-30s. Momentum is weak, with no bullish divergence yet. [Bearish]
- 20 EMA (EMA 13/34 used): EMA 13 is $15.63 and EMA 34 is $15.96. Price at $15.43 sits below both, and EMA 13 is below EMA 34, a bearish alignment. Both averages are sloping down and act as overhead resistance. [Bearish]
- MACD: Line -0.2506 is below Signal -0.2254, with a negative and widening histogram. The line has been under the signal since Nov 12. Momentum is bearish, though the histogram is flattening a little. [Bearish]
- Bollinger Bands (20): Upper $16.74, lower $15.02. Price at $15.43 is in the lower third, about 24% of the band width. The bands are moderately wide after the October volatility, and the lower band is the nearest downside magnet. [Bearish]
- CMF (20): -0.219, well below -0.05. It has stayed negative for most of the recent bars, which points to persistent selling pressure. [Distribution]
- ADX (14): 22.7 and rising from about 17. -DI at 32.1 is far above +DI at 16.9, so bears control a trend that is still building toward the 25 threshold. [Moderate Trend, Bearish]
- Volume: 4.11M, average to slightly below average, with no capitulation spike. Declines are on ordinary volume, so selling is steady but not panicked. [Neutral to mildly bearish]
DIVERGENCES & TRENDS
- No bullish RSI or MACD divergence has formed. Price is near the Nov 13 low ($15.27) and RSI is above its Nov 13 low (28.3), a minor sign of stabilization at best.
- EMA 13 is below EMA 34, and both are below SMA50 ($16.17) and SMA200 ($17.32). SMA50 is below SMA200, so the death-cross structure is in place and the long-term trend is down.
- MACD is below its signal and below zero. The Nov 12-13 window brought a bearish crossover and a trend break from the Nov 11 level of $16.26.
- VWAP is $15.43, essentially equal to price, so price is sitting at fair value. The intraday bounce from $15.27 has stalled below the EMAs.
- CMF has declined from positive readings in early November to -0.22, which confirms distribution.
- ADX is rising while -DI dominates, so the downtrend is gaining strength.
CHART PATTERNS
- The price action fits a Bearish Flag / Descending channel (continuation pattern). The sharp drop from about $16.3 to $15.3 on Nov 12-13 was followed by a tight, low-momentum consolidation around $15.43-$15.55.
- A break below the Nov 13 low of $15.27 would target roughly $14.85-$15.00. That is the flagpole of about $1.0 projected down, though the projection is trimmed here for the 6-day window and the lower Bollinger Band at $15.02.
- A Bearish Rising Wedge-style recovery is possible, with lower highs under the declining EMAs. Reclaiming $15.96 (EMA 34) would invalidate it.
- The Oct 22 to Nov 12 range was $14.5-$17.3. Price is now back in the middle of the larger range, with the October low zone near $14.7 as a deeper support.
POTENTIAL SCENARIOS
- Scenario 1: Bearish Continuation Lower — Price fails at the EMA 13 ($15.63) and breaks the Nov 13 low as −DI stays dominant, CMF stays negative and MACD widens. Trigger: close below $15.27. Target: $14.95-$15.05 (lower Bollinger Band). Invalidation: close above $15.65. (55% probability)
- Scenario 2: Neutral Consolidation / Oversold Bounce Fizzles — RSI near 35 attracts dip buyers, and price chops between $15.25 and $15.65 with no resolution. Trigger: holding $15.27 with RSI turning up. Target: $15.30-$15.60. Invalidation: a break of either boundary on volume. (25% probability)
- Scenario 3: Bullish Relief Rally — An oversold bounce reclaims EMA 13 and pushes to EMA 34. Trigger: close above $15.65 with the MACD histogram turning up. Target: $15.95-$16.00. Invalidation: rejection at $15.96 or a close back below $15.40. (20% probability)
PRICE TARGETS
For a 6-day timeframe, the range width should be about 4-8% of the current price. ATR of $0.22 on hourly bars supports a daily move of about $0.35-0.45, so six days gives a plausible 1-sigma move of $0.8-$1.0.
- Target Price: $15.10 (6 days)
- Expected Range: $14.70 to $15.80 (width $1.10, about 7.1% of the current price, within the 4-8% guidance)
- Key Levels: Support at $15.02 (lower Bollinger Band; below that, $14.72), Resistance at $15.63 (EMA 13; above that, $15.96 at EMA 34)
OVERALL BIAS
OVERALL BIAS: BEARISH - Price is below all major moving averages with a death-cross structure, MACD is below its signal, −DI is far above +DI with ADX rising, and CMF at -0.22 shows distribution. The bearish-flag setup points to a retest of the $15.0 area, although RSI near 35 limits the downside and makes a relief bounce possible.
This is educational analysis and not financial advice.