NBIS 4-day bearish forecast — Nov 15, 2026
- Bias: Bearish
- Timeframe: 4 days (made Nov 15, 2026, target date Nov 18, 2026)
- Price at analysis: $115.81
- Price target: $111.50
- Expected range: $104.50 – $118.50
- Result: Pending — graded after the close on Nov 18, 2026
Get a free AI analysis of NBIS today
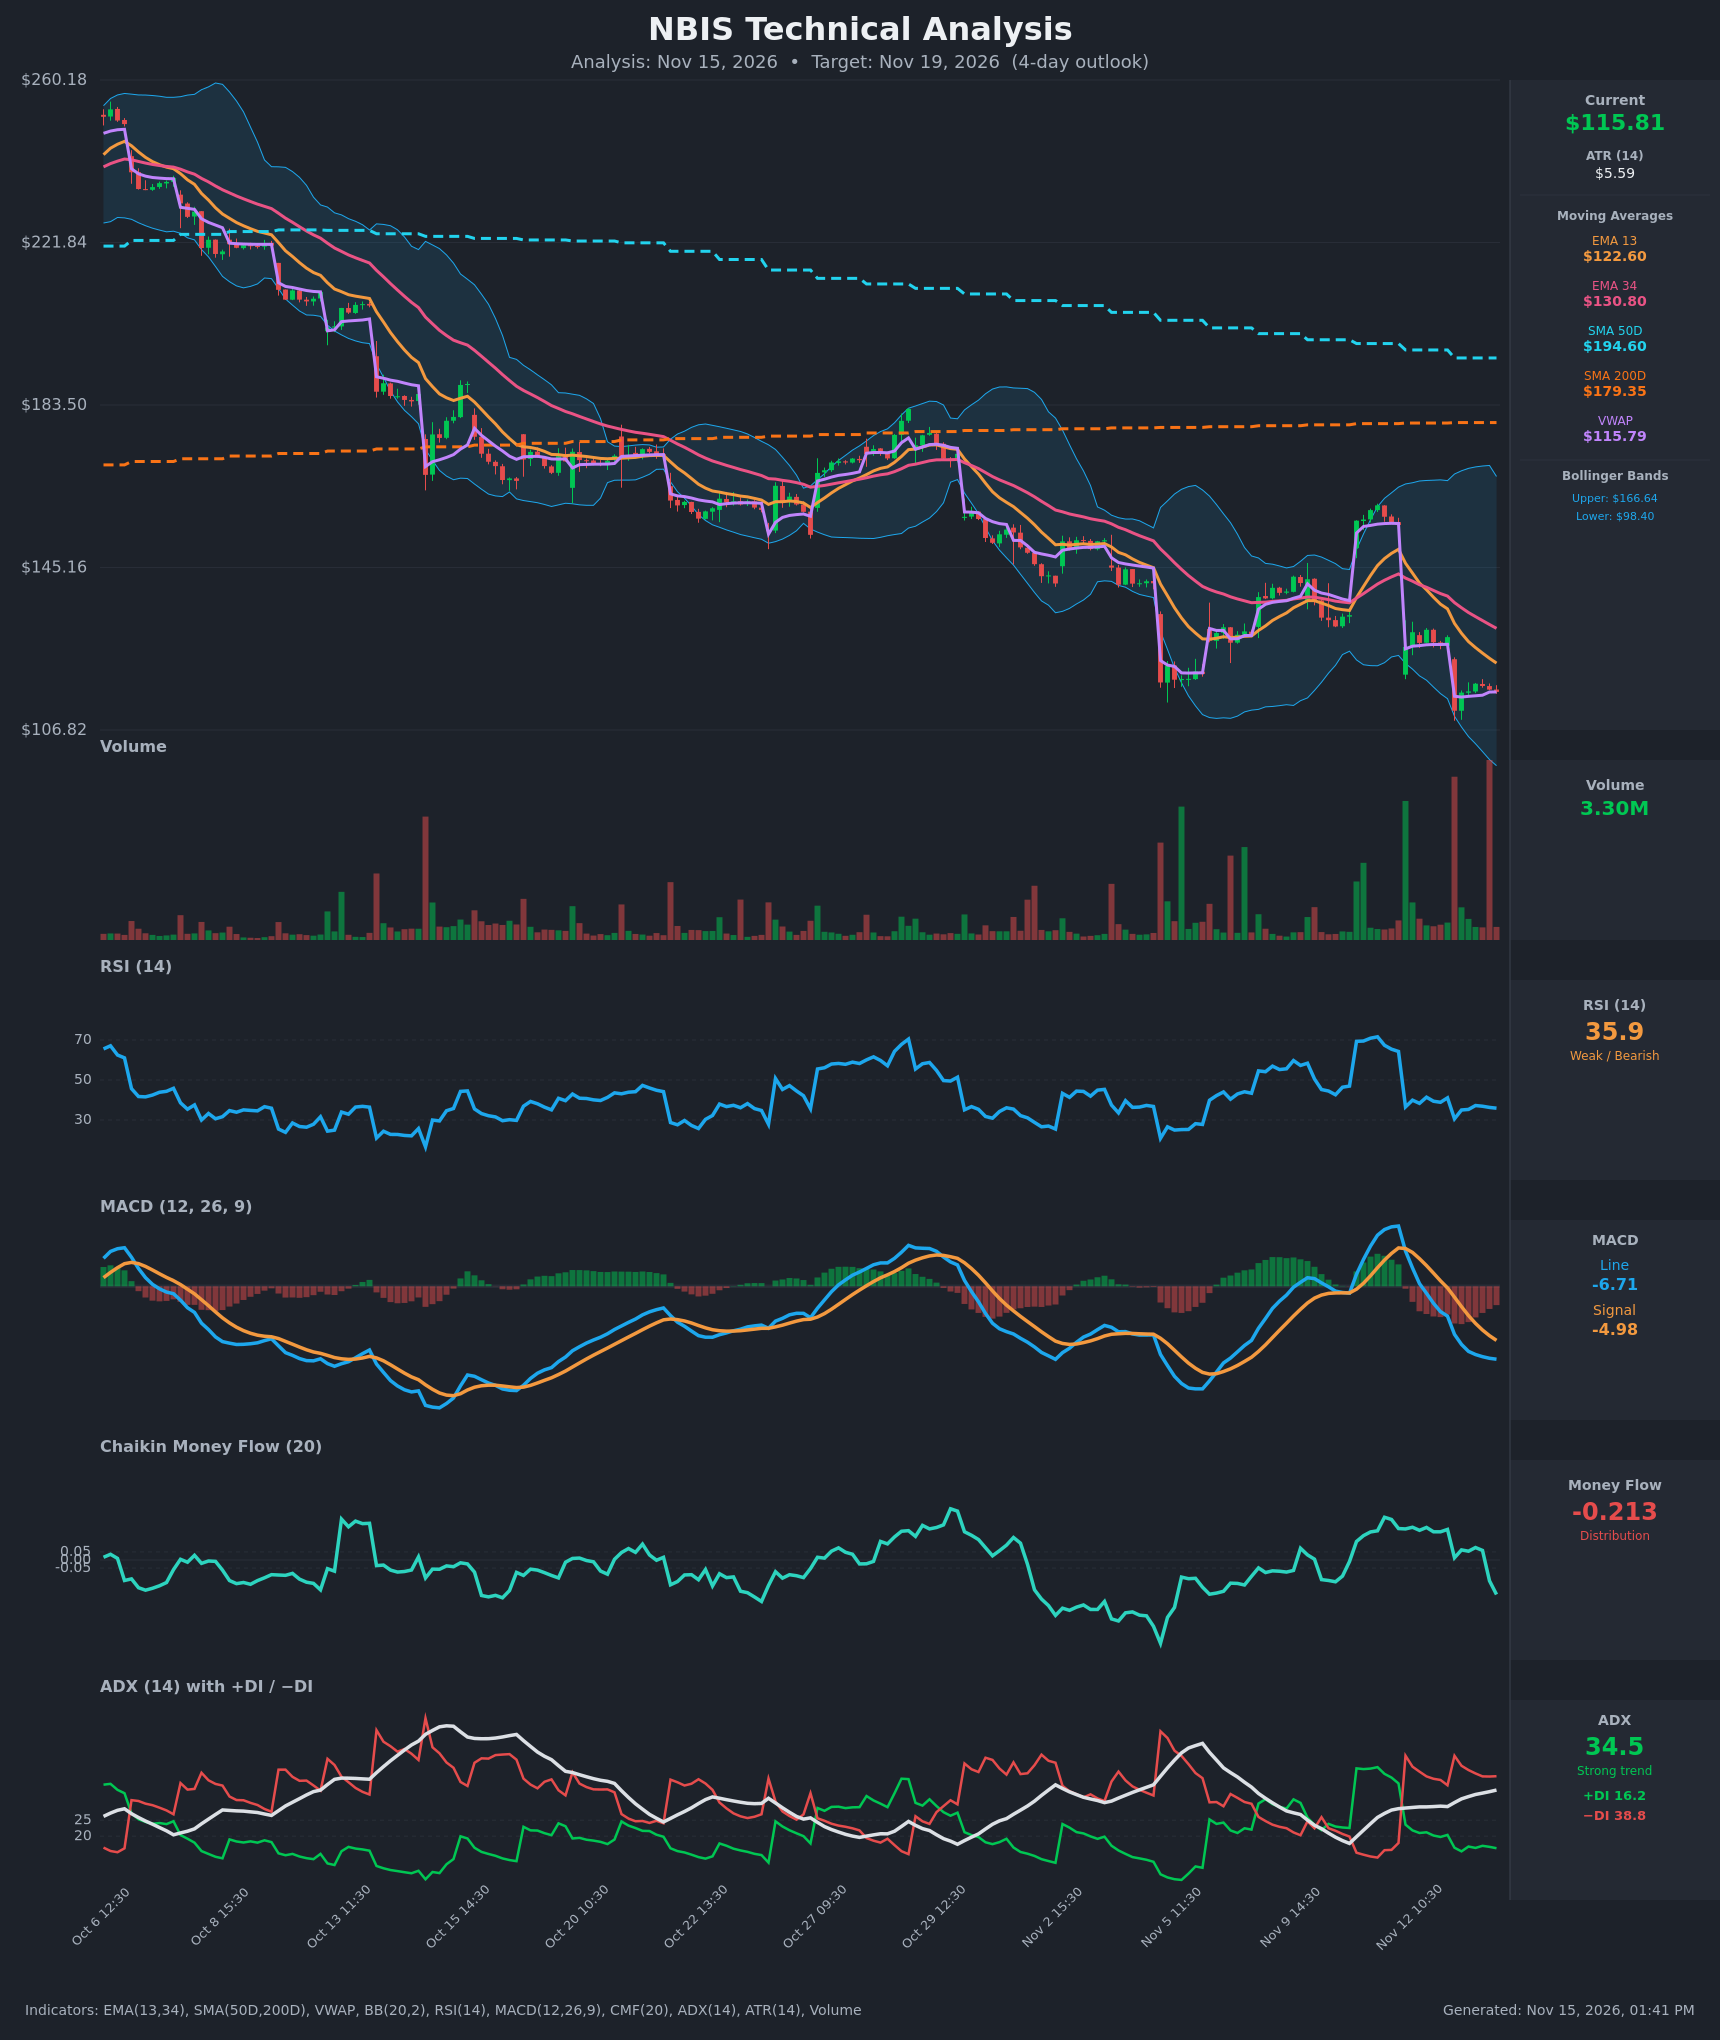
Analysis
TECHNICAL INDICATORS
- RSI (14): 35.90, near the oversold line but not yet below 30. It has stayed in a 30-41 band since the Nov 12 gap down, so momentum is weak with no bullish turn. [Bearish]
- 20 EMA (EMA 13/34 used): EMA 13 is $122.60 and EMA 34 is $130.80. Price at $115.81 is below both, and the fast EMA is below the slow EMA and falling. Both act as overhead resistance. [Bearish]
- MACD: The line is -6.71 and the signal is -4.98. The line crossed below the signal around Nov 12 and the gap is widening, so the histogram is increasingly negative. [Bearish]
- Bollinger Bands (20): Upper is $166.64 and lower is $98.40. Price sits in the lower third, about 25% of the band width above the lower band. The bands are very wide after the volatile swings, so there is room to fall further. Price is not yet at the lower band, so there is no stretched-oversold signal. [Bearish]
- CMF (20): -0.213, well below -0.05. It has dropped from about +0.19 to -0.21 in a few sessions, which points to distribution. [Distribution]
- ADX (14): 34.5 and rising, with -DI at 38.8 above +DI at 16.2. This is a strong downtrend with sellers firmly in control. [Strong Trend – Bearish]
- Volume: 3.30M on the latest bar. Heavy volume on the gap-down bars (Nov 12 and Nov 13) confirms selling pressure. Price is also sitting right at VWAP ($115.79), which shows no buyer follow-through. [Bearish confirmation]
DIVERGENCES & TRENDS
- There is no bullish RSI or MACD divergence. RSI made a similar low (about 30-36) on this leg as on earlier legs, but price made a lower low and MACD is at a new low. This is momentum confirmation, not divergence.
- The long-term structure is bearish. Price is far below SMA200D ($179.35) and SMA50D ($194.60), and SMA50D is also well above SMA200D, a lagging remnant of the earlier uptrend. A death cross is not far off if the decline continues.
- The EMA 13/34 bearish crossover occurred around Nov 12, and the gap between them is widening.
- The MACD bearish crossover (Nov 12) is confirmed, and -DI crossed back above +DI at the same time.
- Price has made a series of lower highs and lower lows from the $260 area down to about $111. Each bounce has failed at or below the falling EMAs.
- Price is pinned to VWAP after the gap-down, so VWAP ($115.79) is the immediate pivot.
CHART PATTERNS
- The broader structure is a persistent downtrend with stair-step gap-downs, a continuation setup.
- The small consolidation since Nov 13, between about $111 and $118, resembles a Bearish Flag/Pennant from the reference diagram. A breakdown below $111-112 would project toward $105 or lower, using the measured move of the Nov 13 drop of roughly $17 as a guide.
- A Bullish Falling Wedge is not confirmed. There is no converging trendline structure with a breakout.
- The nearest upside hurdles are VWAP/EMA 13 at about $122-123, then EMA 34 at about $131.
POTENTIAL SCENARIOS
- Scenario 1: Bearish Flag Breakdown Continuation — Sellers keep control and price breaks the Nov 13 low, with MACD, CMF and -DI all supportive. Trigger: a close below $111.00 on rising volume. Target: $104-$108, with a stretch toward the lower band near $98.40. Invalidation: a close above $122.60 (EMA 13). (55% probability)
- Scenario 2: Neutral Consolidation Near Lows — Price chops between $111 and $120 as RSI sits near 35 and sellers pause. Trigger: holding above $111 with lower volume. Target: $112-$119. Invalidation: a break outside $110-$122. (20% probability)
- Scenario 3: Bullish Oversold Relief Bounce — A short-covering bounce from the RSI 30-36 zone and the lower-band area. Trigger: a reclaim of VWAP/$118 with a volume pickup. Target: $122-$127 (EMA 13 and gap-fill resistance). Invalidation: failure at $122.60 and a drop back below $115. (25% probability)
PRICE TARGETS
For the 4-day timeframe, the range width should be roughly 3-6% of the current price. ATR of $5.59 suggests a typical 4-day move of about $8-11, so I'm using the upper end of the guidance.
- Target Price: $111.50
- Expected Range: $104.50 to $118.50 (width $14.00, about 12.1%). This is wider than the guideline because ATR is elevated and the stock has been gapping, so the 4-day range is set from ATR rather than the standard percentage.
- Key Levels: Support at $110.50 (Nov 13 low area), Resistance at $122.60 (EMA 13 / gap resistance)
OVERALL BIAS
OVERALL BIAS: BEARISH - Price is below all key moving averages with a bearish MACD crossover, ADX at 34.5 with -DI dominant, CMF at -0.21, and a bearish-flag consolidation just above recent lows. Oversold RSI near 36 allows for a bounce, but the weight of evidence favors a continued push toward the $105-$111 area.
This is educational analysis and not financial advice.