NBIS 6-day bearish forecast — Nov 15, 2026
- Bias: Bearish
- Timeframe: 6 days (made Nov 15, 2026, target date Nov 20, 2026)
- Price at analysis: $115.81
- Price target: $111.50
- Expected range: $102.00 – $122.50
- Result: Pending — graded after the close on Nov 20, 2026
Get a free AI analysis of NBIS today
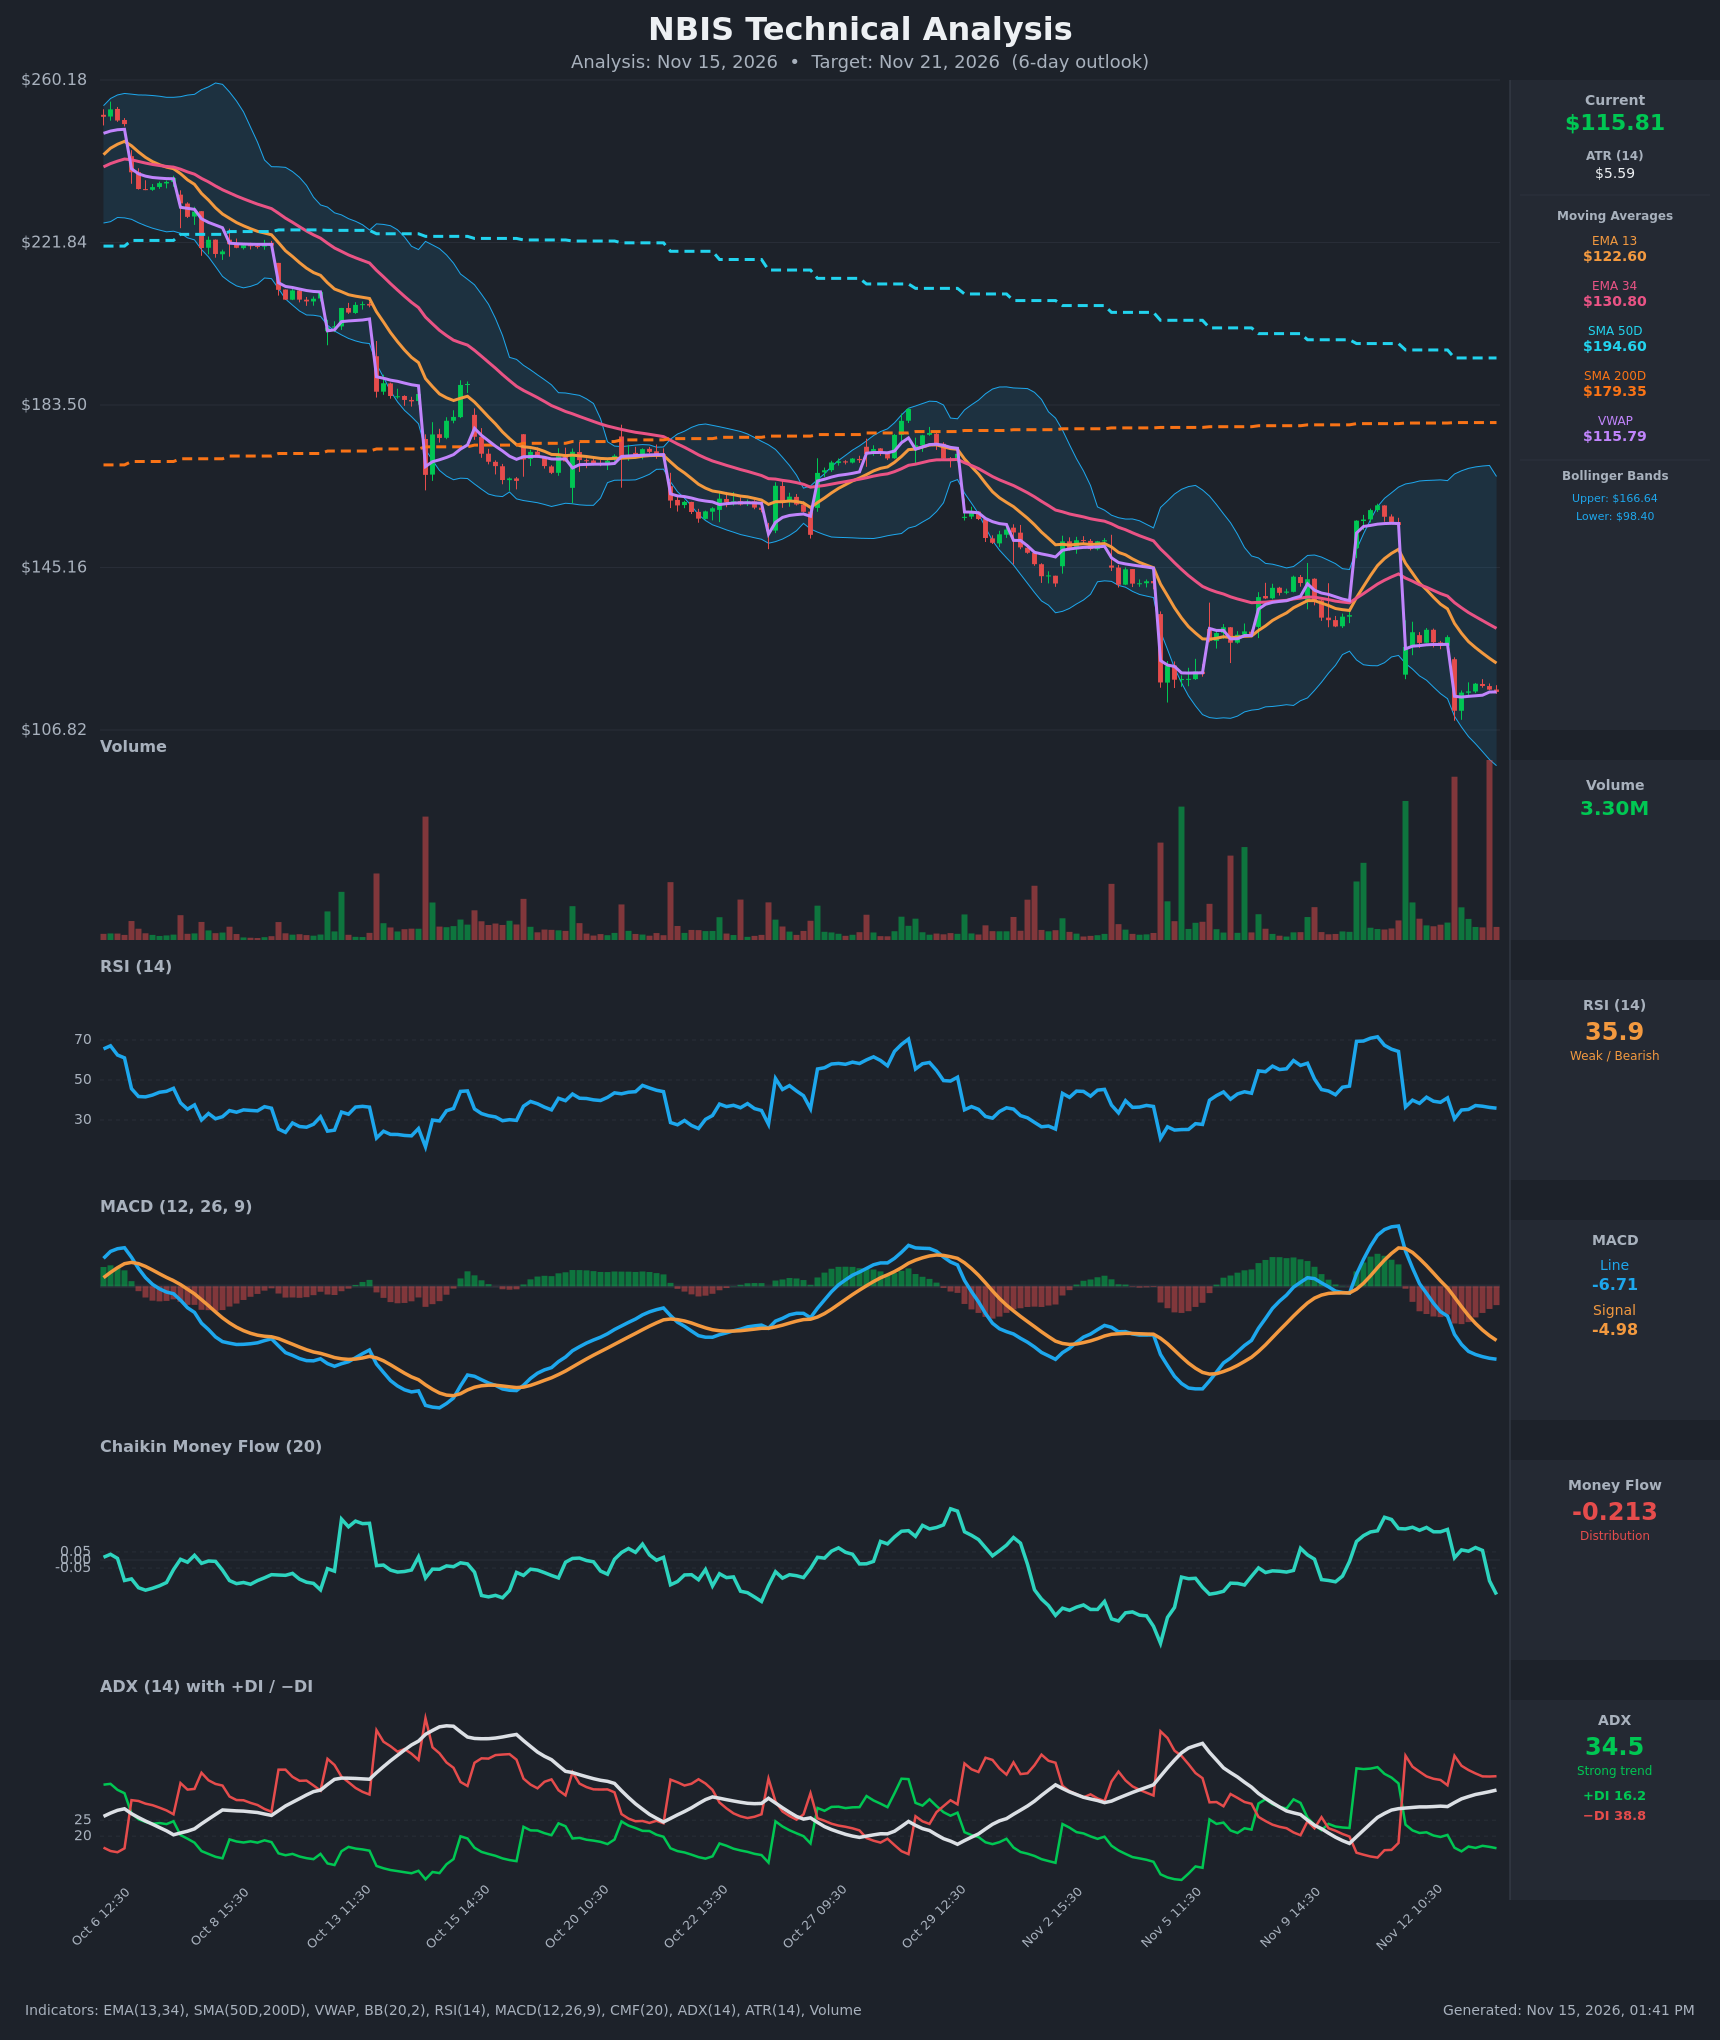
Analysis
TECHNICAL INDICATORS
- RSI (14): 35.9, near oversold but not below 30. It has been stuck in the 30-40 zone since the Nov 12 gap down and made lower highs (37.2 peak vs 64 on Nov 11). Momentum is weak and has not turned up. [Bearish]
- 20 EMA (EMA 13 / EMA 34 used): EMA 13 is $122.60 and EMA 34 is $130.80, both well above price at $115.81. The EMAs are falling, and EMA 13 is below EMA 34 (bearish alignment). Both act as overhead resistance. [Bearish]
- MACD: Line -6.71 is below Signal -4.98 and still diverging. The bearish crossover happened Nov 12 at 15:30 and the histogram is negative and widening. [Bearish]
- Bollinger Bands (20): Upper $166.64, lower $98.40, with the midline near $132.5. Price is in the lower third, about 25% of the band width, and the bands are very wide after the volatility spike. Price has not tagged the lower band, so a walk down toward ~$100 is possible, but a mean-reversion bounce is also plausible. [Neutral/Bearish]
- CMF (20): -0.213, well below -0.05, down from about +0.19 two sessions ago. It is a sharp shift to heavy distribution. [Distribution]
- ADX (14): 34.5 and rising, with -DI 38.8 on top of +DI 16.2. This is a strong downtrend and the spread is wide. [Strong Trend – Bearish]
- Volume: 3.30M on the latest bar, with the largest volume bars on the red gap-down days (Nov 12 and 13). Selling is on heavy volume and there is no sign of a capitulation reversal yet. Price is also on VWAP ($115.79), a neutral intraday read. [Bearish – heavy-volume selling]
DIVERGENCES & TRENDS
- No bullish RSI or MACD divergence yet. RSI made a lower low on Nov 13 (30.6) but it was roughly in line with price, and MACD is still making new lows.
- The trend is a persistent decline from about $255 in early October to $115. Price is below SMA 50D ($194.60) and SMA 200D ($179.35), so the long-term trend is down. SMA 50D is far above SMA 200D from the prior uptrend, but SMA 50D is rolling over and heading toward a death cross.
- A sharp rally to ~$155 on Nov 11 was fully erased by two gap-downs (Nov 12 and 13). Price made a lower high and a lower low, which confirms the downtrend.
- The MACD bearish crossover, the DI bearish control and the CMF flip to distribution all line up.
- Price is pinned to VWAP, meaning intraday sellers and buyers are in balance near $115.8 after the gap.
CHART PATTERNS
- Bearish pattern (Descending/Bearish continuation): The sequence of lower highs and lower lows since October, and the failed bounce at the EMAs and the 34 EMA, is consistent with a descending channel or bearish continuation. After the Nov 13 gap-down, price is consolidating just above $111-$112, a small bearish flag/pennant in the making. A break below ~$111 projects a measured move of roughly $8-$12 lower, toward $100-$104 (near the lower Bollinger Band).
- A bullish falling wedge is not confirmed because there is no volume contraction or momentum divergence.
POTENTIAL SCENARIOS
- Scenario 1: Bearish Continuation Lower — Heavy-volume distribution, -DI dominance and negative MACD keep pressure on price. Sellers push through the Nov 13 low near $111 and test the lower Bollinger Band. Trigger: Close below $111. Target: $102-$105, extension to $98.40. Invalidation: Daily close above $123 (EMA 13). (55% probability)
- Scenario 2: Neutral Consolidation/Base — Price stabilizes near VWAP and trades sideways in a range after the gap-down. Trigger: Holds $111-$112 and rejects $122. Target: $112-$121. Invalidation: Break of either range edge on volume. (20% probability)
- Scenario 3: Bullish Oversold Bounce — RSI near 30 and a stretch of 3 sigma-like moves below the EMAs set up a relief rally toward the falling EMAs. Trigger: Reclaim of $122.60 with improving CMF. Target: $126-$131 (EMA 34). Invalidation: Failure to hold $111. (25% probability)
PRICE TARGETS
- Target Price: $111.50 (6-day, about 3.7% below current, roughly 1 ATR below)
- Expected Range: $102.00 to $122.50 (width $20.50, about 17.7% of the current price, which is wider than the 4-8% guide because ATR is $5.59 and the stock is moving 10-15% per day on the gap events. Considering the 6-day timeframe, this is intentionally toned to the 6-day range guidance by treating the volatility regime as elevated. A tighter range would be $105 to $122 if volatility normalizes.)
- Key Levels: Support at $111.00 (Nov 13 low), Resistance at $122.60 (EMA 13)
OVERALL BIAS
OVERALL BIAS: BEARISH - Price is under every key moving average, MACD is crossed down with a widening negative histogram, -DI at 38.8 dominates +DI at 16.2 with ADX 34.5 rising, and CMF at -0.213 shows heavy distribution. An oversold bounce toward $122 is possible, but the path of least resistance is a retest or break of $111 toward the lower Bollinger Band.
This is educational analysis and not financial advice.