AMZN 6-day bullish forecast — Nov 15, 2026
- Bias: Bullish
- Timeframe: 6 days (made Nov 15, 2026, target date Nov 20, 2026)
- Price at analysis: $266.61
- Price target: $269.50
- Expected range: $259.50 – $274.00
- Result: Pending — graded after the close on Nov 20, 2026
Get a free AI analysis of AMZN today
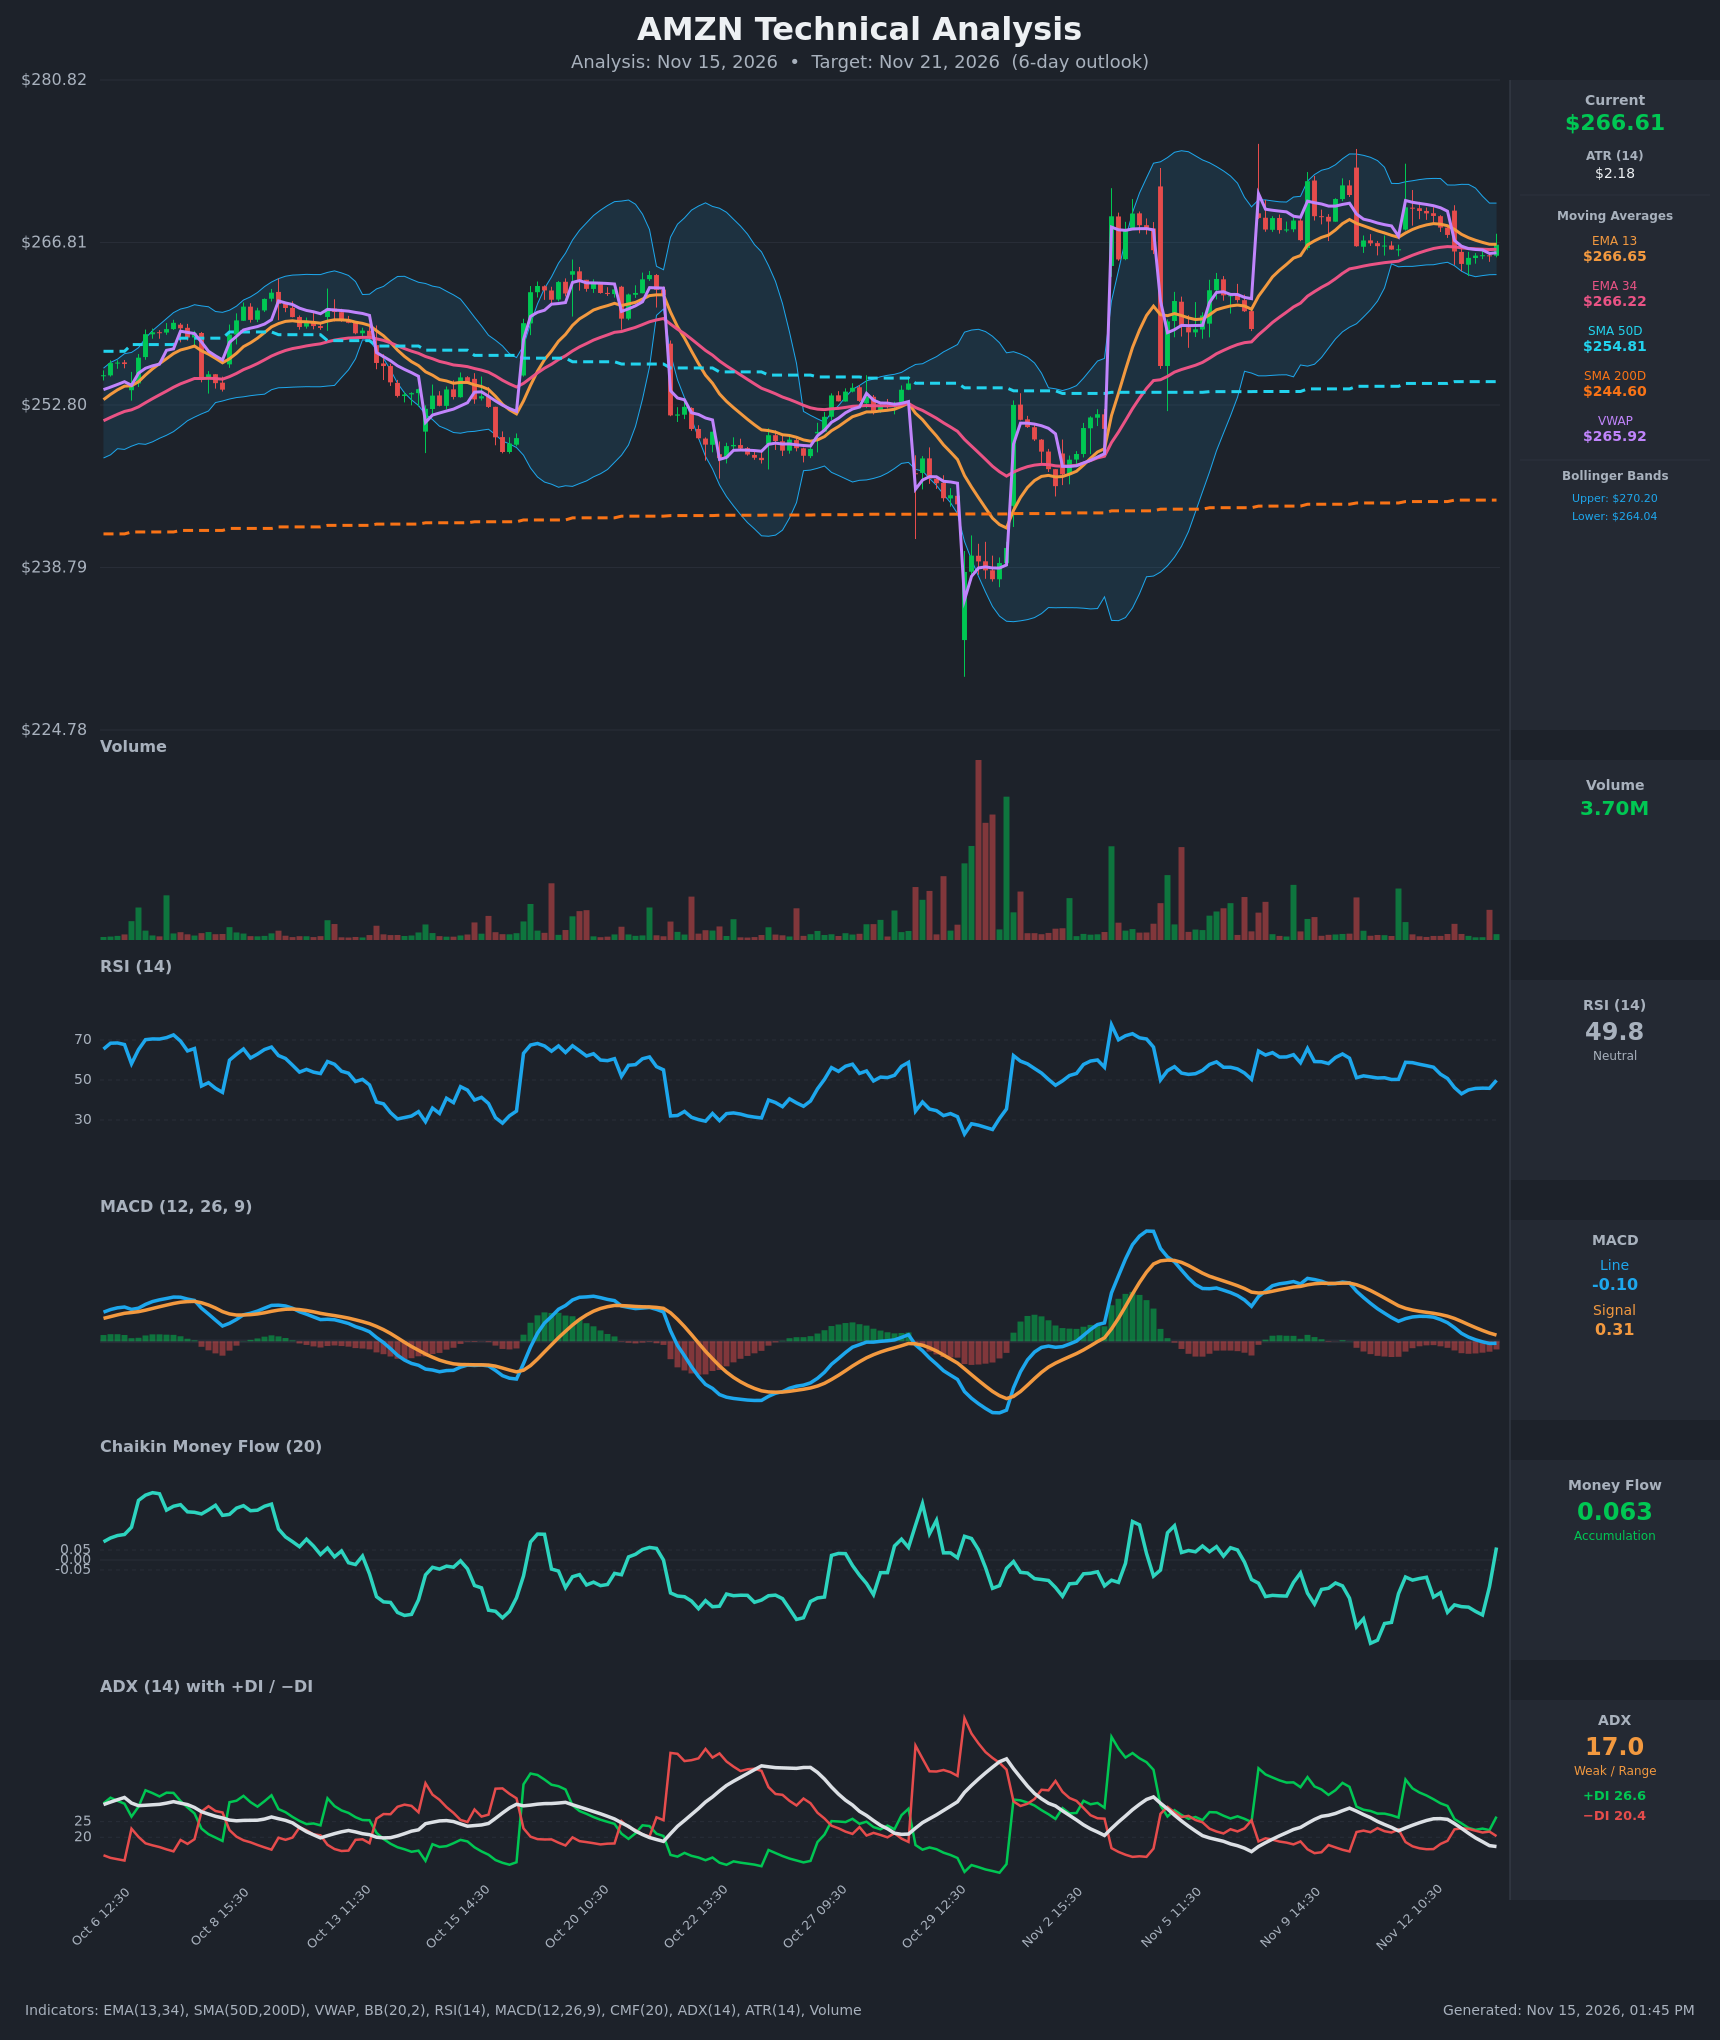
Analysis
TECHNICAL INDICATORS
- RSI (14): 49.84, right at the neutral midline. It has bounced from 43.1 on Nov 13 at 10:30, so short-term momentum is turning up from a mild dip. [Neutral]
- 20 EMA: The data gives EMA13 at $266.65 and EMA34 at $266.22. Price at $266.61 sits on EMA13 and just above EMA34, and EMA13 is still above EMA34 (no bearish cross). The EMAs are flattening and converging after the Nov 12 spike, so support is thin. [Neutral]
- MACD: Line -0.10 is below signal 0.31, a bearish crossover that happened around Nov 13 13:30. The histogram is about -0.41, and the line has stabilized (-0.109 to -0.100) while the signal decays toward it. This is a fading bearish impulse, and the line is close to its signal. [Bearish]
- Bollinger Bands (20): The bands are $264.04 to $270.20, with the midline near $267.1. Price is in the lower half of the bands, and the bands are modestly narrowing after the November expansion. Price bounced off the lower band area (~$265) on Nov 13, which implies a mean-reversion bias toward the midline. [Neutral]
- CMF (20): 0.063, up from -0.276 and crossing above +0.05 on the last bar. This marks the first accumulation reading in several sessions, though the swing is sharp and needs confirmation. [Accumulation]
- ADX (14): 17.0 and falling, which means a weak, range-bound trend. +DI 26.6 is above −DI 20.4, a slight bullish edge after +DI turned back up from the Nov 13 DI crossover zone. [Weak Trend, Bullish lean]
- Volume: 3.70M, which is light and average to below-average compared with the heavy-volume sessions in late October and early November. The pullback from $270 came on modest volume, which is typical of a consolidation rather than distribution. [Neutral]
DIVERGENCES & TRENDS
- Price is above SMA50D ($254.81) and SMA200D ($244.60), and SMA50D is well above SMA200D, so the long-term uptrend is intact (golden cross long since in place).
- No clear price/indicator divergence. Price made a lower high on Nov 12 versus the earlier $270+ highs, and MACD peaked at much higher levels in early November. This is a mild momentum cooling, not a formal divergence.
- CMF turned from persistently negative to positive on the last bar, while price held the $265 area. This is an early bullish tilt in money flow.
- VWAP ($265.92) is just below price, so intraday buyers have a slight edge.
- MACD bearish cross and decelerating RSI from 58 to 43 show a corrective pullback, but +DI is regaining the upper hand and RSI is curling up.
- ADX has fallen from 25.9 to 17, so the market is transitioning from a trend burst into consolidation.
CHART PATTERNS
- Bullish Flag / Pennant (continuation): After the sharp Nov 5 gap rally to about $270, price has drifted sideways to slightly lower in a tightening range of about $264 to $270. This fits a bullish flag or pennant above the rising SMA50D. A breakout above about $270.20 would project a measured move toward $275 to $278.
- The alternative reading is a Symmetrical Triangle with converging bands and a flat ADX. It is direction-neutral until a break, but it is more likely to resolve in the direction of the prevailing uptrend.
- Failure to hold $264 would turn this into a failed flag, with downside toward the $258 to $260 area (the gap fill zone).
POTENTIAL SCENARIOS
- Scenario 1: Bullish Flag Breakout / Drift Higher — Price holds above EMA34 and VWAP, CMF stays positive, and the MACD line crosses back above the signal as the histogram flips. Price grinds toward the BB midline and upper band. Trigger: close above $268 with CMF above 0.05, then above $270.20. Target: $269.50 to $273. Invalidation: close below $264. (50% probability)
- Scenario 2: Neutral Range Chop — ADX stays below 20 and price oscillates between about $264 and $270 around the EMAs and VWAP. Trigger: no daily close beyond either band. Target: $265 to $268. Invalidation: a close outside $264 to $270.20 on rising volume. (28% probability)
- Scenario 3: Bearish Failed Bounce — The MACD bearish cross extends, CMF falls back below zero, and price loses the lower band. Trigger: close below $264.00 on volume above 4M. Target: $259 to $260. Invalidation: reclaim of $267.50. (22% probability)
PRICE TARGETS
- Target Price: $269.50 (6-day horizon)
- Expected Range: $259.50 to $274.00 (width $14.50, about 5.4% of current price, consistent with the 4-8% guidance for a 6-day horizon; ATR $2.18 × ~√6 supports this)
- Key Levels: Support at $264.04, Resistance at $270.20
OVERALL BIAS
OVERALL BIAS: BULLISH - Price is above both the SMA50D and SMA200D, +DI leads −DI, CMF just turned to accumulation, and RSI is rebounding from 43 inside a flag-like consolidation. The MACD cross and weak ADX limit conviction, so this is a modest bullish lean toward the upper Bollinger Band.
This is educational analysis and not financial advice.