AMZN 4-day bullish forecast — Nov 15, 2026
- Bias: Bullish
- Timeframe: 4 days (made Nov 15, 2026, target date Nov 18, 2026)
- Price at analysis: $266.61
- Price target: $268.00
- Expected range: $262.80 – $270.80
- Result: Pending — graded after the close on Nov 18, 2026
Get a free AI analysis of AMZN today
Analysis
TECHNICAL INDICATORS
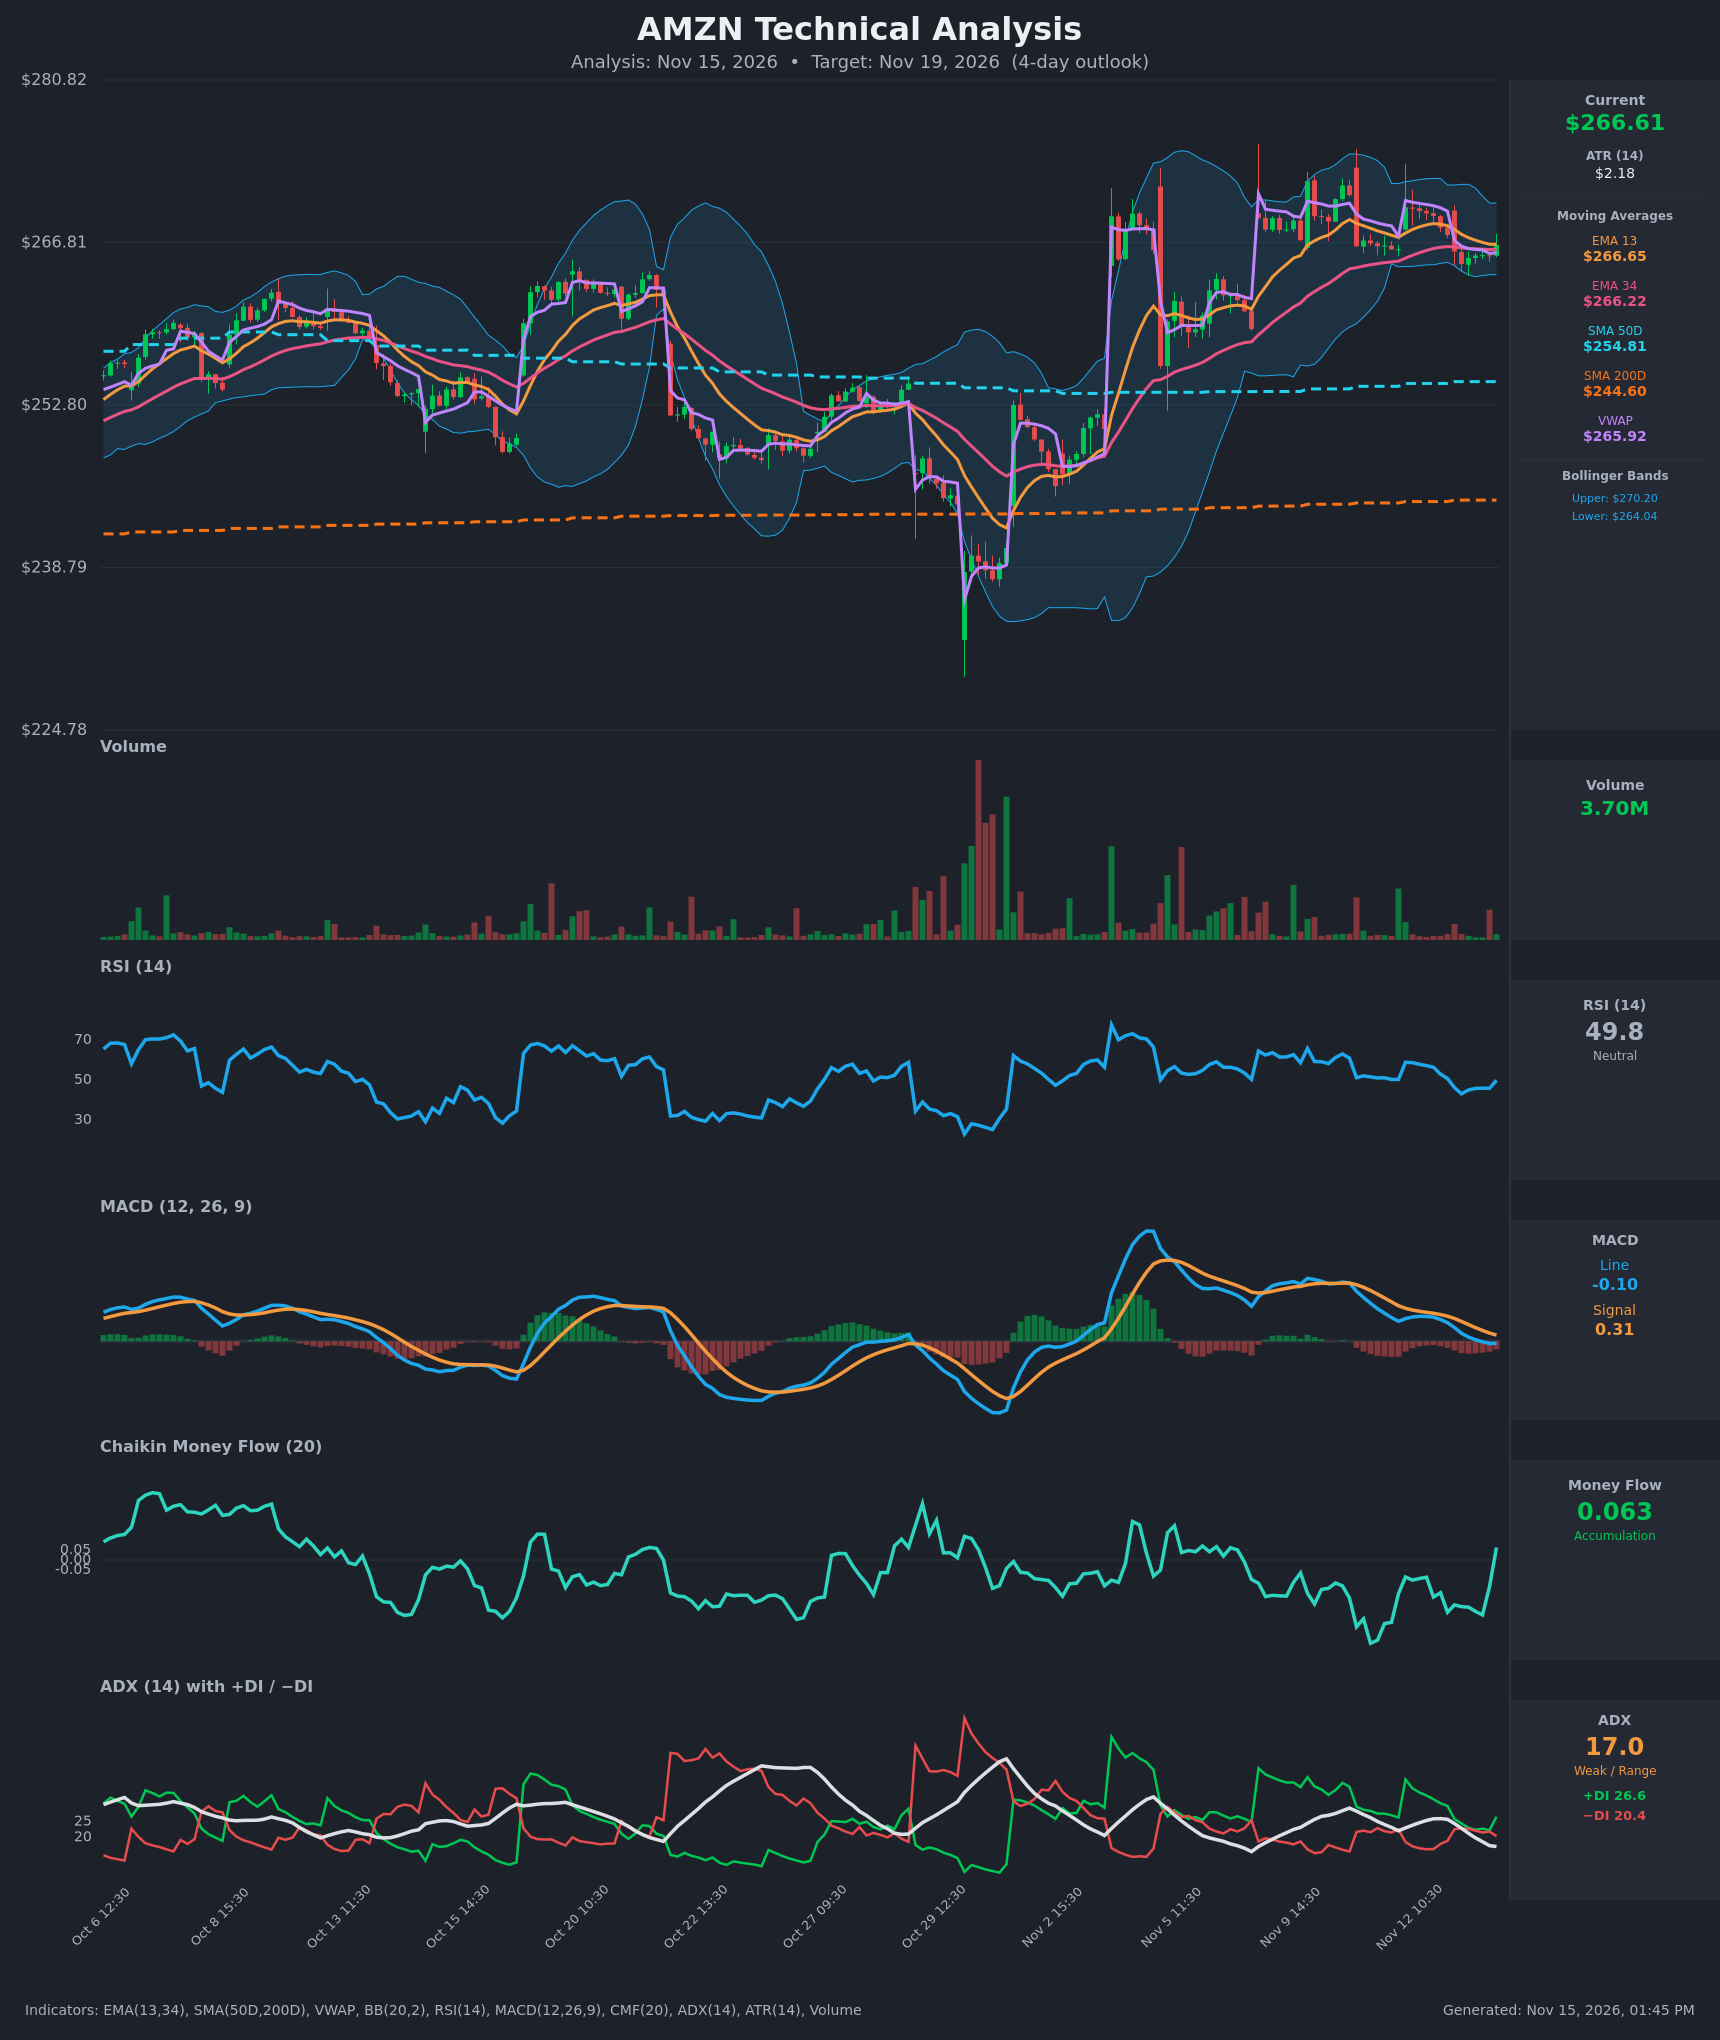
- RSI (14): 49.84, dead neutral. It dropped from 58.9 (Nov 12) to a low of 43.1, then bounced to 49.8 on the last bar. Momentum has stopped falling but has not yet turned up convincingly. [Neutral]
- EMA 13 / EMA 34: EMA13 is $266.65 and EMA34 is $266.22. Price at $266.61 sits right on EMA13 and just above EMA34. EMA13 is still above EMA34, so the structure is intact, but the gap has narrowed from about $2.05 to $0.43. Price is pinned to both averages. [Neutral]
- MACD: The line is -0.10 and the signal is 0.31, so the histogram is about -0.41. The line crossed below the signal around Nov 12-13 and is under zero. The histogram is shrinking in magnitude (it was roughly -0.5 earlier), so downside momentum is fading but the bearish crossover is still in force. [Bearish]
- Bollinger Bands (20): Upper $270.20, lower $264.04, midline about $267.12. Price is in the lower half of the bands after tagging the lower band area (~$264.96 low) and bouncing. The bands are narrow compared with the volatile October/early-November period, which points to compression. [Neutral]
- CMF (20): 0.063, which just flipped from -0.134 to positive, above the +0.05 threshold. It was negative for most of the past several sessions, so this is a fresh signal and needs confirmation. [Accumulation]
- ADX (14): 17.0 and falling from 25.9, which is weak and range-bound. +DI (26.6) crossed back above −DI (20.4) on the last bar, a slight bullish tilt in a non-trending market. [Weak Trend, slight bullish bias]
- Volume: 3.70M on the last bar, light and in line with the quiet recent sessions. There are no spikes confirming a breakdown, and the up bounce came on modest volume. [Neutral / no conviction]
Other context:
- Price is above VWAP ($265.92), which is mildly supportive.
- Price is above SMA50 ($254.81) and SMA200 ($244.60), so the long-term uptrend is intact.
- SMA50 is above SMA200, which is a bullish long-term configuration with no recent cross.
DIVERGENCES & TRENDS
- Pullback within an uptrend: Price peaked near $269.84 on Nov 12 and has retraced about $3.2 to ~$265. The pullback was shallow and held the EMA34/VWAP zone.
- MACD: It has rolled over from a peak near 1.26 to -0.10. The bearish cross happened, but the histogram is contracting, so selling pressure is decelerating.
- Last-bar shift: In the final bar RSI jumped from 45.8 to 49.8, CMF went from -0.134 to +0.063, and +DI crossed back above −DI. Several indicators turned up together, which is an early sign of a bounce.
- No clear divergence: Price made a lower low area at ~$264.96 while RSI made a higher low relative to the early-November troughs, but this is not a clean divergence.
- Trend strength: ADX at 17 and falling means directional moves are likely to be limited and mean-reverting in the near term.
CHART PATTERNS
- Continuation-type consolidation: After the strong November rally, price is drifting sideways to slightly lower between ~$264 and ~$270. This resembles a Bullish Flag / Pennant from the reference, a pause within an uptrend. A break above ~$268-270 would project a measured move toward $272-274.
- Failed double-top risk: The $269.8-$270 highs on Nov 12 and earlier act as resistance. A Bearish Double Top would only be confirmed on a break below ~$264, which has not happened.
- The pattern is not clean, so treat targets as modest.
POTENTIAL SCENARIOS
- Scenario 1: Bullish Bounce Within Uptrend — Price holds the EMA34/VWAP/lower-band support, the CMF turn to accumulation holds, and price rotates back toward the Bollinger midline and the upper range. Trigger: close above $267.60 (BB midline area / recent resistance) with CMF staying above +0.05. Target: $268.00-$270.00. Invalidation: close below $264.00. (45% probability)
- Scenario 2: Neutral Range Chop — ADX stays below 20 and price oscillates around the EMAs and VWAP. Trigger: failure to break above $268 or below $265. Target: $265.00-$268.00. Invalidation: close outside $263.50-$270.50. (30% probability)
- Scenario 3: Bearish Breakdown — MACD stays below signal and price loses the lower Bollinger Band and VWAP/EMA support. Trigger: close below $264.00. Target: $260.50-$262.00. Invalidation: close back above $267.60. (25% probability)
PRICE TARGETS
- Target Price: $268.00 (4-day horizon)
- Expected Range: $262.80 to $270.80. The width is $8.00, or about 3.0% of the current price, which fits the 2-4% guidance for a 2-4 day horizon.
- Key Levels: Support at $264.04, Resistance at $270.20
OVERALL BIAS
OVERALL BIAS: BULLISH - The long-term uptrend is intact (price above SMA50 and SMA200). Price is holding EMA34 and VWAP after a lower-band bounce, and CMF, RSI and +DI all turned up on the last bar. The bias is modest because MACD is still below signal and ADX is weak.
This is educational analysis and not financial advice.