AAPL 6-day bullish forecast — Nov 15, 2026
- Bias: Bullish
- Timeframe: 6 days (made Nov 15, 2026, target date Nov 20, 2026)
- Price at analysis: $356.40
- Price target: $359.00
- Expected range: $348.50 – $366.00
- Result: Pending — graded after the close on Nov 20, 2026
Get a free AI analysis of AAPL today
Analysis
TECHNICAL INDICATORS
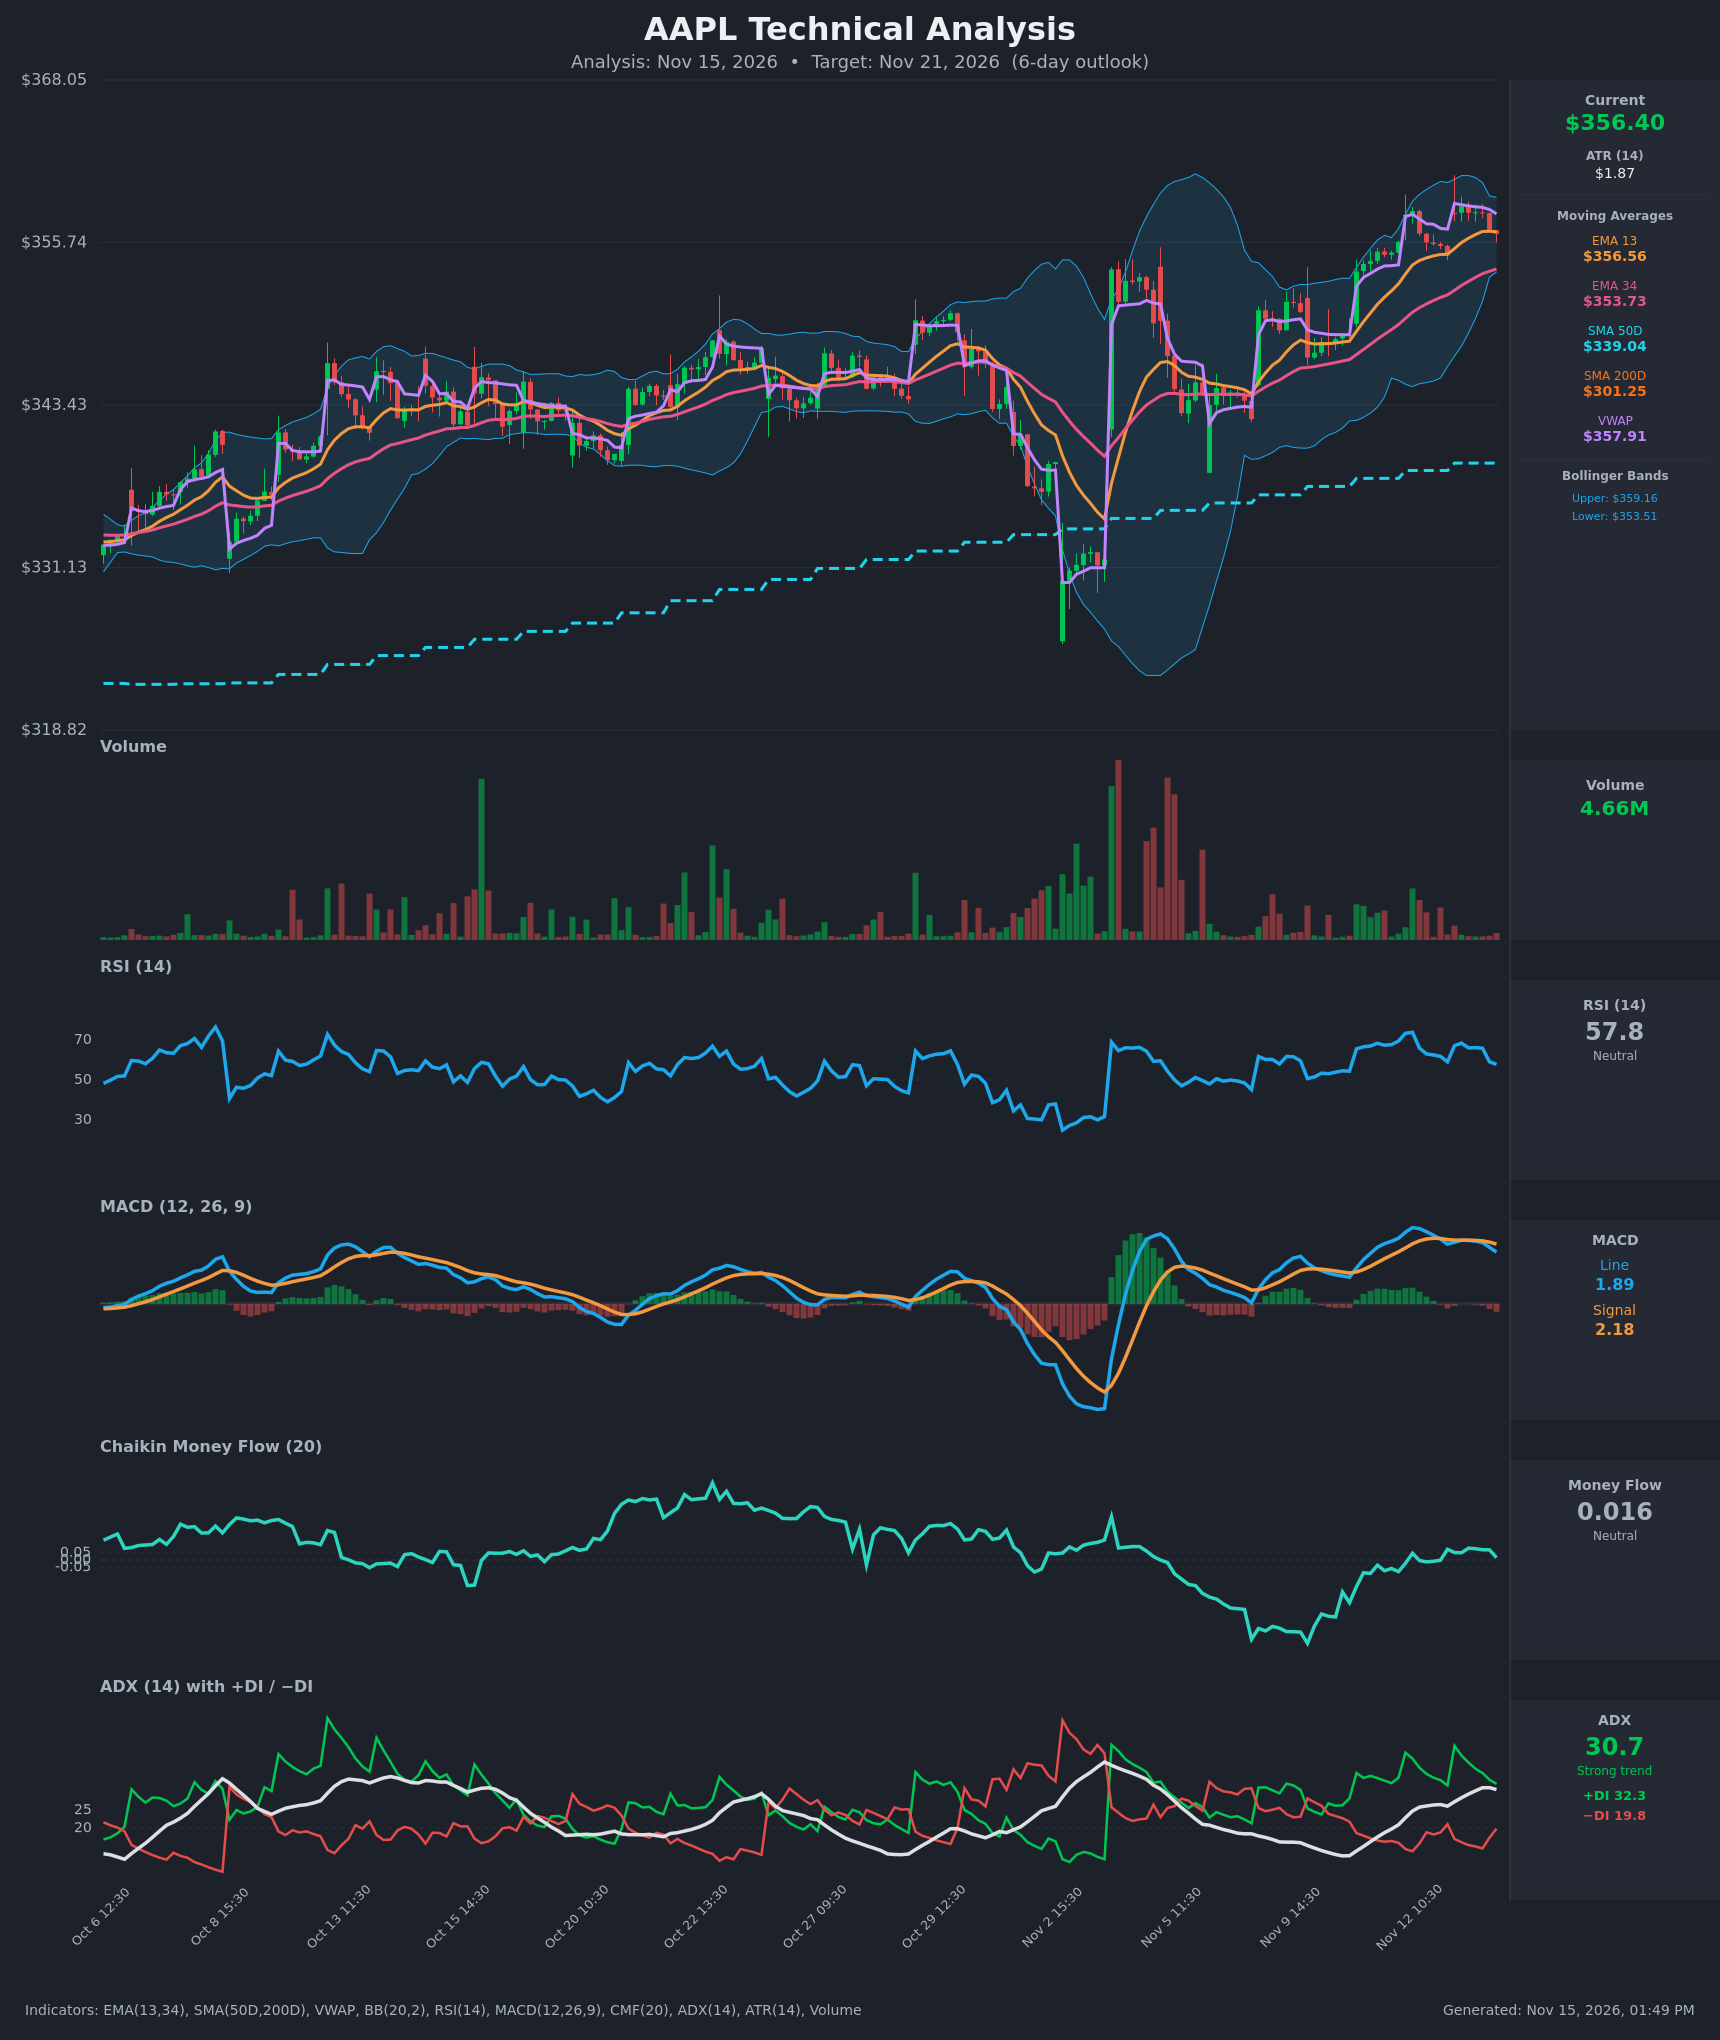
- RSI (14): 57.8, down from 68.4 at the Nov 13 10:30 bar and from the 73+ overbought readings on Nov 12. Momentum is cooling but still above 50, so it has reset without breaking down. [Neutral]
- 20 EMA: The data provides EMA 13 ($356.56) and EMA 34 ($353.73) rather than a 20 EMA. Price at $356.40 is just below EMA 13 and about $2.67 above EMA 34. EMA 13 is above EMA 34, so the short-term trend is up, and EMA 34 is the first real support. [Bullish]
- MACD: Line 1.889 is below Signal 2.183, with a negative histogram of about -0.29. The bearish cross happened around Nov 12 14:30–15:30 and the gap has widened. Both lines are still positive, so this looks like a pullback in an uptrend, not a trend reversal. [Bearish]
- Bollinger Bands (20): Upper $359.16, lower $353.51, so price sits near the midline (~$356.3). Price was rejected near the upper band (~$358.5) on Nov 13. The bands are moderately narrow after the earlier expansion, which points to a consolidation that could resolve either way. [Neutral]
- CMF (20): 0.016, between ±0.05. It has recovered from a deep negative reading in early November but faded from 0.08 to 0.016 in the last few bars. Buying pressure is not convincing. [Neutral]
- ADX (14): 30.7 with +DI 32.3 above −DI 19.8. This is a strong trend with bulls in control. ADX has just ticked down from 31.3, and the gap between +DI and −DI has narrowed from the 42.9/17.0 reading on Nov 13 morning. [Strong Trend – Bullish]
- Volume: 4.66M, light compared with the heavy spikes seen in early November. The recent pullback is on modest volume, which suggests no aggressive distribution. [Neutral / mildly constructive]
Other moving averages and VWAP:
- Price is above SMA50 ($339.04) and SMA200 ($301.25), a long-term uptrend with SMA50 well above SMA200 (golden cross long since in place). [Bullish]
- Price is below VWAP ($357.91), a mild short-term seller edge. [Bearish]
DIVERGENCES & TRENDS
- Momentum divergence: Price made a slightly higher high (~$358.48 vs ~$358.13), while RSI peaked lower (68.4 vs 73.8) and MACD peaked lower. This is a minor bearish divergence on the hourly chart.
- Crossovers: The MACD bearish cross is recent. EMA 13 is still above EMA 34 and the spread is stable. There is no +DI/−DI cross.
- Trend: The stair-step advance from ~$342 in early November to ~$358 is intact, with higher lows. Pullbacks have held at or above EMA 34.
- ADX: It is at 30.7 and flattening, which suggests the trend is pausing, not ending.
- VWAP: Price has slipped under VWAP for a few bars. Reclaiming ~$358 would restore short-term momentum.
CHART PATTERNS
- Bullish continuation (flag/consolidation): After a sharp advance, price has drifted sideways to slightly lower between ~$354.9 and ~$358.5 on fading momentum. This resembles a Bullish Flag. A breakout above ~$358.5 would project roughly +$4 to +$5, to about $362–$363.
- Minor Double Top (bearish risk): There are two highs near $358.1 and $358.5, with a neckline around $354.9 (the Nov 12 15:30 low). A close below that would target roughly $351.5. Because it forms inside a strong uptrend above EMA 34, I treat it as a lower-probability reversal.
- Net view: The pattern favors continuation, with $354.9 and $353.7 as the lines to watch.
POTENTIAL SCENARIOS
- Scenario 1: Bullish Trend Resumption — Price holds the EMA 34 / lower-band zone, MACD flattens, and buyers push through the double-top highs, in line with the strong ADX and bulls in control. Trigger: a close above $358.50 and a reclaim of VWAP (~$357.9). Target: $362–$365. Invalidation: a close below $353.50. (50% probability)
- Scenario 2: Bearish Pullback / Double-Top Break — The MACD bearish cross extends and the RSI divergence plays out, with a break of the $354.9 neckline. Trigger: a hourly close below $354.90 with rising volume. Target: $350–$351.5, then SMA50 area $345 if selling accelerates. Invalidation: a reclaim of $358.50. (30% probability)
- Scenario 3: Neutral Range Chop — Price oscillates between ~$353.5 and ~$358.5 with weak volume. Trigger: failure to break either side of the Bollinger envelope. Target: $355–$357. Invalidation: a decisive close outside $353.50–$358.50. (20% probability)
PRICE TARGETS
- Target Price: $359.00 (6-day)
- Expected Range: $348.50 to $366.00 (width $17.50, about 4.9% of current price, consistent with the ~4–8% guidance for this horizon)
- Key Levels: Support at $353.73 (EMA 34 / lower Bollinger band area), Resistance at $358.50 (recent swing highs / upper Bollinger band)
OVERALL BIAS
OVERALL BIAS: BULLISH - The long-term trend is strong (price above SMA50/SMA200, ADX 30.7, +DI well above −DI), and the current dip looks like a consolidation holding above EMA 34. The fading RSI and the MACD bearish cross argue for a shallow pullback first, so conviction is modest.
This is educational analysis and not financial advice.