AAPL 4-day bullish forecast — Nov 15, 2026
- Bias: Bullish
- Timeframe: 4 days (made Nov 15, 2026, target date Nov 18, 2026)
- Price at analysis: $356.40
- Price target: $358.80
- Expected range: $350.00 – $363.00
- Result: Pending — graded after the close on Nov 18, 2026
Get a free AI analysis of AAPL today
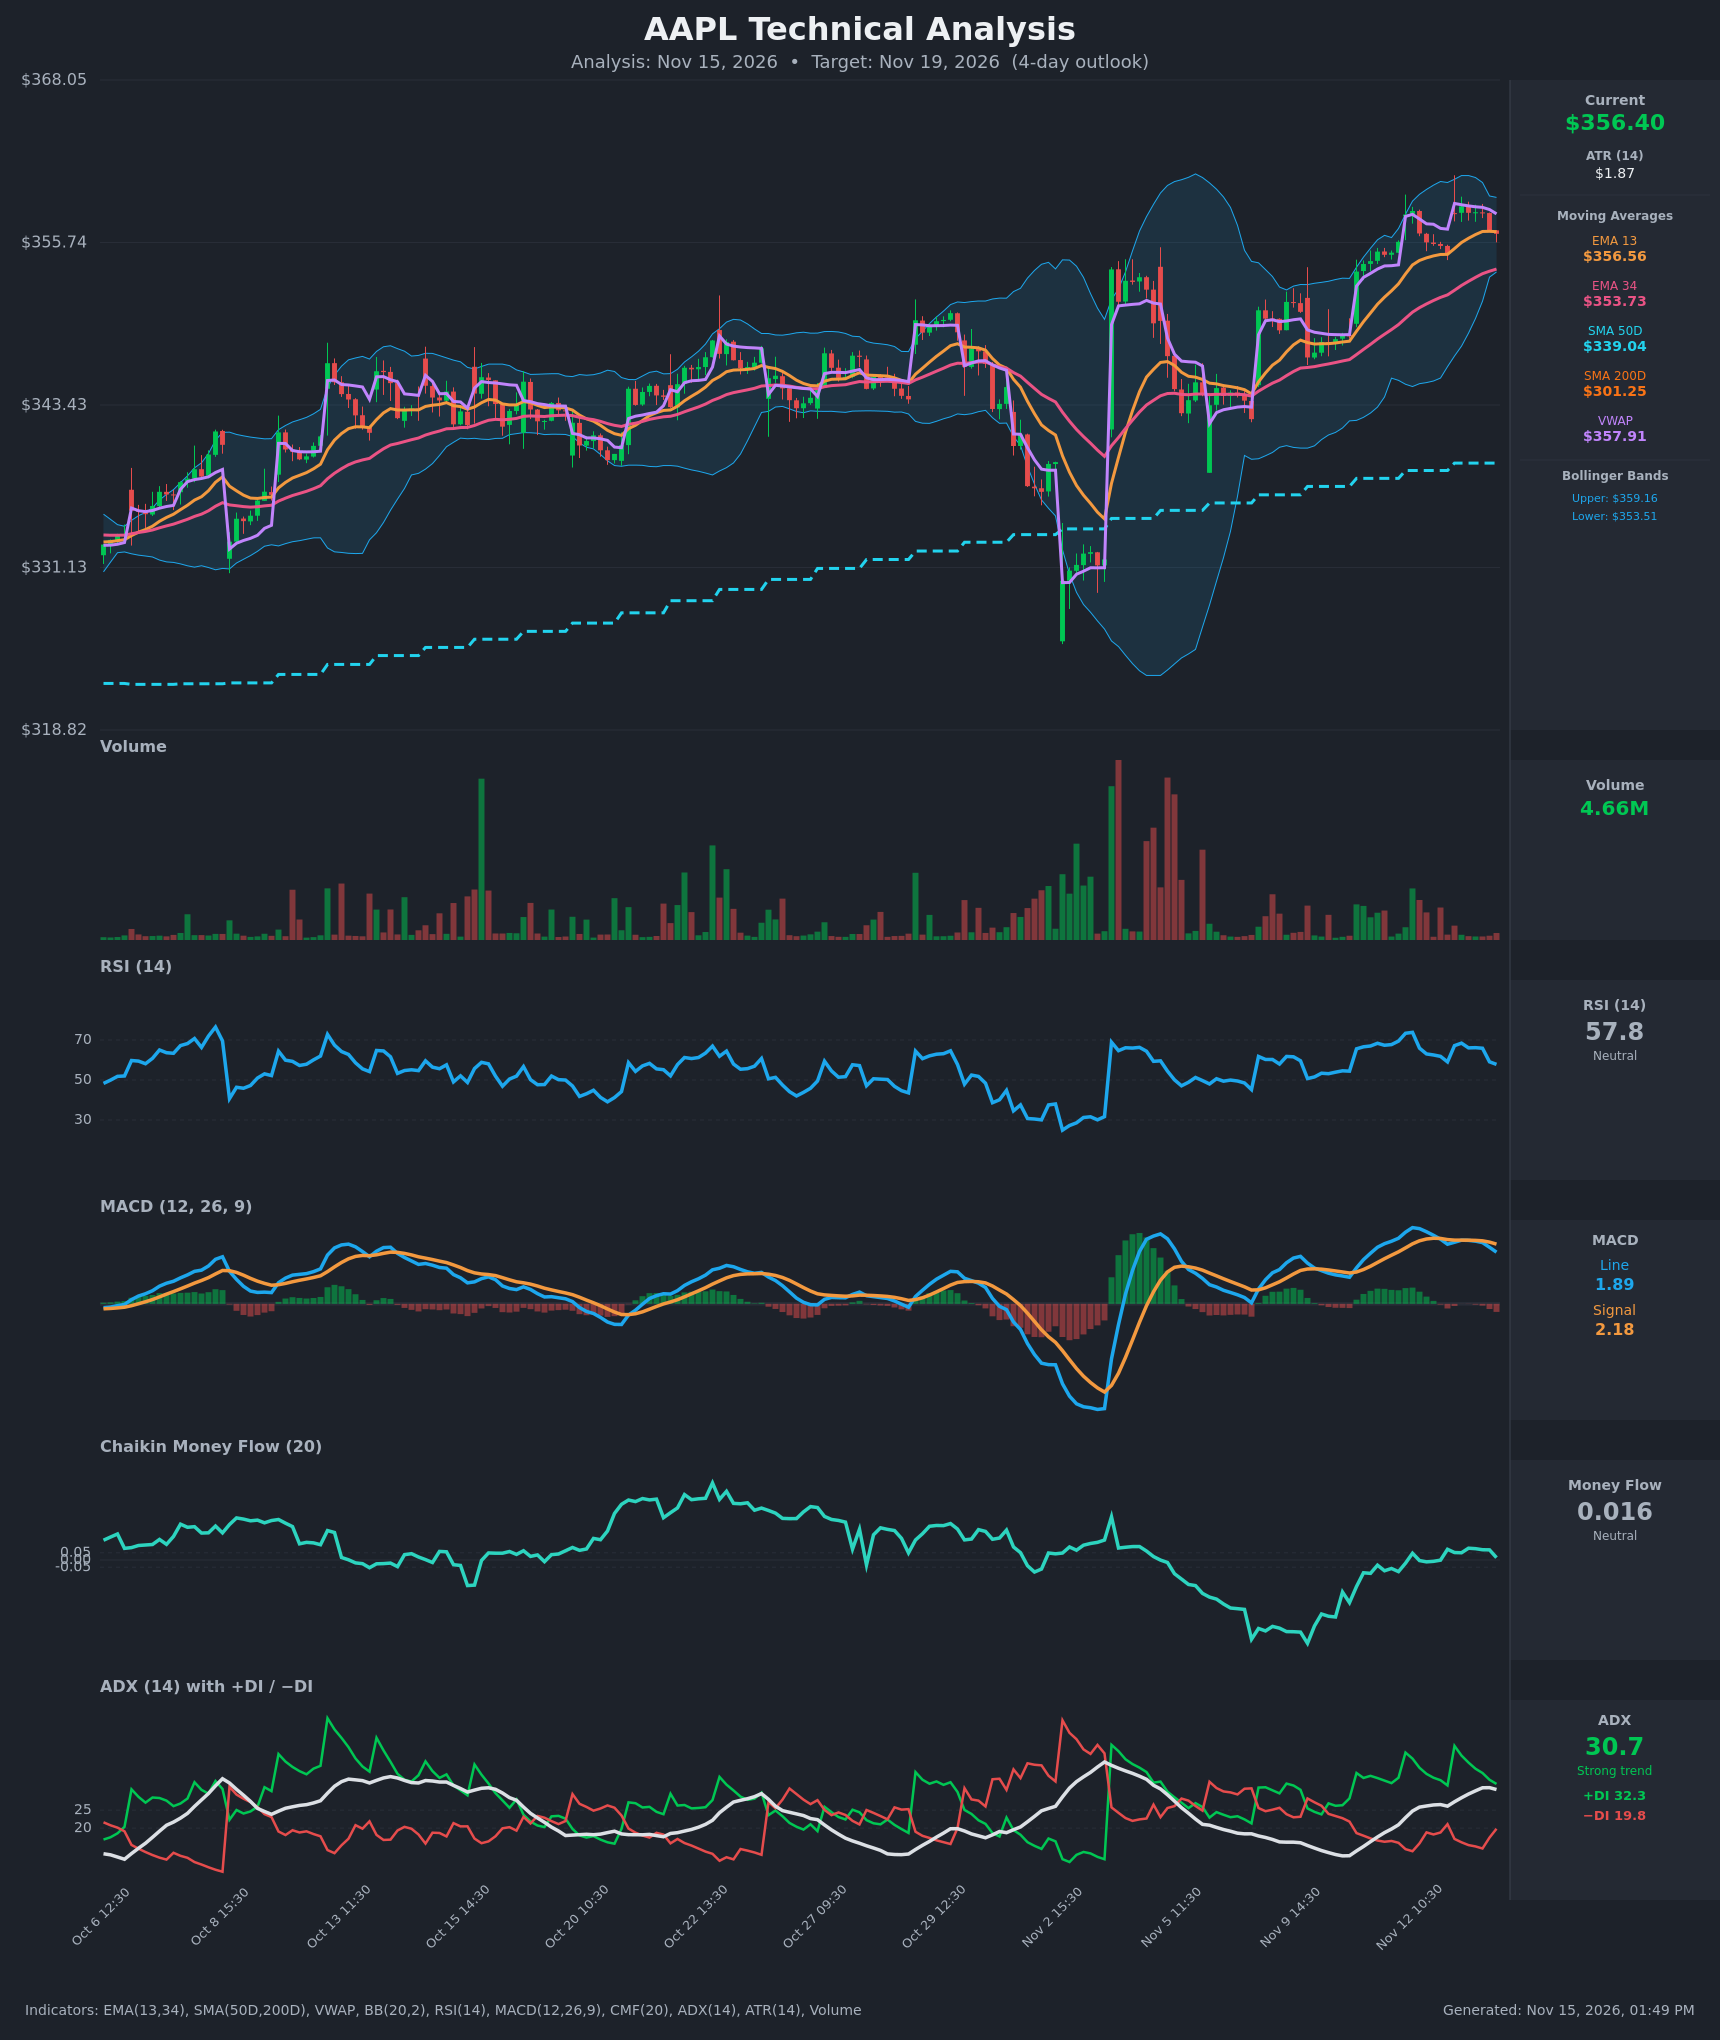
Analysis
TECHNICAL INDICATORS
- RSI (14): 57.80, down from about 68 at the Nov 13 morning high and 73 on Nov 12. Momentum is cooling but still above 50 with room before overbought. [Neutral]
- 20 EMA: The data gives EMA 13 at $356.56 and EMA 34 at $353.73. Price ($356.40) sits right on the EMA 13, which has flattened, and well above the EMA 34, which is still rising. EMA 13 is above EMA 34, so the short-term trend structure is intact. The EMA 34 is the next dynamic support. [Bullish]
- MACD: Line 1.889 is below Signal 2.183. A bearish crossover occurred around Nov 12 14:30 and the histogram is negative at about -0.29 and widening. Both lines are still positive, which makes this a momentum pause rather than a trend reversal. [Bearish]
- Bollinger Bands (20): Upper $359.16, lower $353.51, so the midline is about $356.3. Price is sitting on the midline after rejecting the upper band area near $358.5. The bands are moderately narrow after the prior expansion, which points to consolidation. [Neutral]
- CMF (20): 0.016 is inside the ±0.05 neutral zone. It has recovered from the deep negative reading in early November, but buying pressure has not clearly returned. [Neutral]
- ADX (14): 30.7, a strong trend, and it is rising from about 21 on Nov 11. +DI at 32.3 is well above −DI at 19.8. +DI has slipped from 42.9 and −DI has ticked up, so bulls are in control but the edge is narrowing. [Strong Trend + Bullish]
- Volume: 4.66M is light, with no heavy distribution on the pullback from $358.5. Chart volume is subdued compared with the early-November spike. The pullback lacks selling conviction, but the rally also lacks strong buying. [Neutral]
DIVERGENCES & TRENDS
- Price is holding near its highs ($358.48 on Nov 13 vs. $358.13 on Nov 12), while RSI (68 vs. 74) and MACD (peak about 2.79 vs. 2.33) made lower peaks. This is a mild bearish momentum divergence on the hourly chart and suggests a pause or pullback.
- The MACD bearish crossover and the drop in RSI from 68 to 58 over the last few hours show short-term fading momentum.
- Price is below VWAP ($357.91), a mild intraday bearish tilt, as buyers have not defended VWAP.
- The larger trend is firmly bullish:
- Price is above SMA50D ($339.04) and far above SMA200D ($301.25). The 50D is well above the 200D, so the golden cross is long established.
- EMA 13 is above EMA 34, and ADX is above 25 with +DI dominant.
- The recovery from the Nov 3-5 selloff has produced a clean staircase of higher highs and higher lows.
CHART PATTERNS
- Bullish Flag / Pennant (continuation): After the sharp climb from about $342 to $358, price has been consolidating in a tight $354.9-$358.5 band. Resolution higher above $358.5 projects a move toward $361-$363, the flagpole-measured extension.
- Minor Bearish Double Top: Twin highs near $358.1-$358.5 on Nov 12 and 13 with a neckline around $354.9-$355.5. Combined with the lower momentum peaks, a close below the neckline would target about $351.5-$352. This is a smaller-scale risk to the bullish read, and it fits with the MACD divergence.
- Net read: A continuation consolidation within a strong uptrend is slightly favored over a reversal. The trend indicators (ADX, DI, MA stack) outweigh the fading oscillators.
POTENTIAL SCENARIOS
- Scenario 1: Bullish Consolidation Breakout — The flag resolves higher as the trend resumes, with price reclaiming VWAP and pushing through the $358.5 highs. Trigger: close above VWAP ($357.91) and then above $358.50, with the MACD histogram turning up. Target: $360.50-$362.50, with the upper Bollinger Band at $359.16 as the first hurdle. Invalidation: close below $353.50 (EMA 34 and lower Bollinger Band). (50% probability)
- Scenario 2: Bearish Pullback to EMA 34 — The MACD bearish cross and RSI divergence lead to a deeper retracement, with the minor double top neckline breaking. Trigger: hourly close below $354.90, with −DI rising toward +DI. Target: $353.50-$351.50. Invalidation: reclaim of $358.00 on a closing basis. (33% probability)
- Scenario 3: Neutral Range Chop — Price oscillates between $354 and $358.5 around the Bollinger midline while ADX flattens. Trigger: no hourly close beyond either boundary. Target: $355-$357.50. Invalidation: any decisive close outside the $353.50-$359.20 band. (17% probability)
PRICE TARGETS
Timeframe: 4 days (Nov 19, 2026), with a range width of about 3.6% of current price, between the 2-3 day and 7-10 day guidance.
- Target Price: $358.80 (4-day horizon)
- Expected Range: $350.00 to $363.00 (width $13.00, about 3.6% of $356.40)
- Key Levels: Support at $353.70 (EMA 34, with lower Bollinger Band at $353.51 just below), Resistance at $359.20 (upper Bollinger Band, just above the $358.50 recent high)
OVERALL BIAS
OVERALL BIAS: BULLISH - A strong trend (ADX 30.7, +DI 32.3 vs. −DI 19.8), price above all key moving averages, and a tight consolidation near highs favor continuation. The MACD bearish cross, falling RSI and price below VWAP argue for a brief dip toward $353.7 first, so conviction is modest.
This is educational analysis and not financial advice.