F 6-day bearish forecast — Nov 15, 2026
- Bias: Bearish
- Timeframe: 6 days (made Nov 15, 2026, target date Nov 20, 2026)
- Price at analysis: $11.91
- Price target: $11.78
- Expected range: $11.50 – $12.15
- Result: Pending — graded after the close on Nov 20, 2026
Get a free AI analysis of F today
Analysis
TECHNICAL INDICATORS
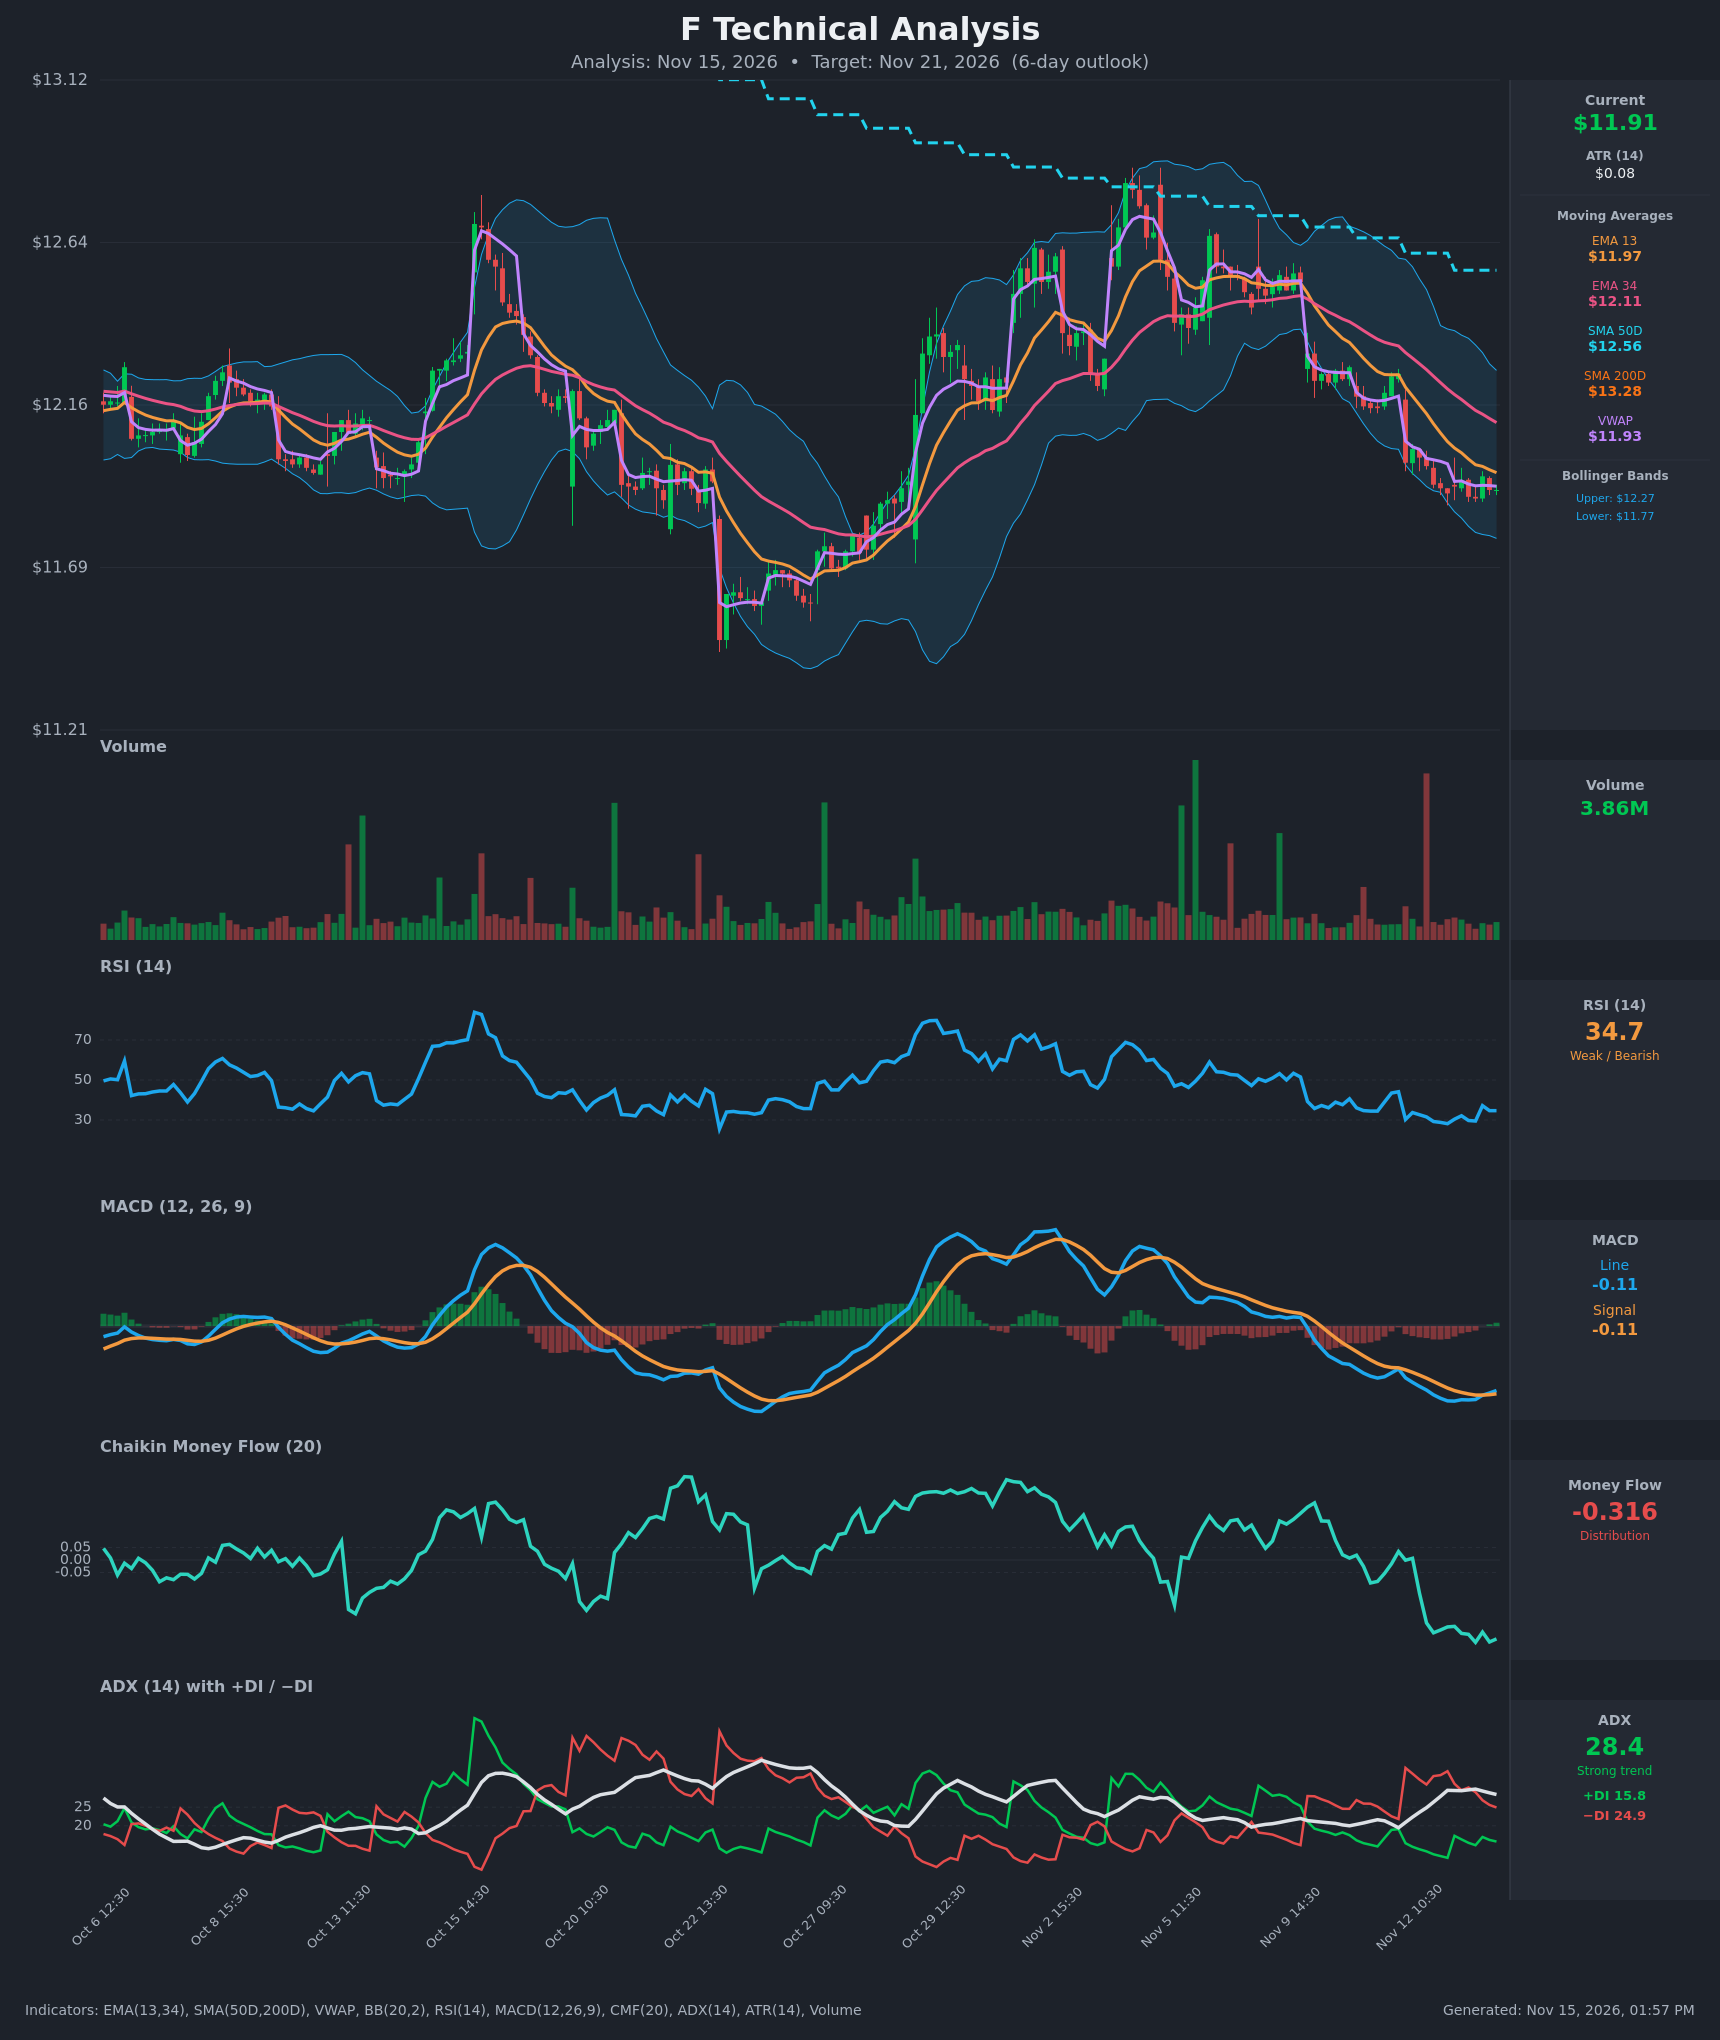
- RSI (14): 34.66, near oversold but not below 30. It has spent most of the last 15 bars between 28 and 37, so momentum is weak and has only bounced slightly off the 28 low. [Bearish]
- 20 EMA: The data gives EMA 13 at $11.97 and EMA 34 at $12.11. Price at $11.915 is below both, so they act as resistance. EMA 13 is still sloping down, and EMA 13 is below EMA 34 (bearish alignment). [Bearish]
- MACD: The line is -0.1073 and the signal is -0.1129. The line has just crossed above the signal (-0.115/-0.115 at 13:30, now a small positive histogram of about +0.006). Both lines are negative and well below zero, so this is a tentative bullish cross within a downtrend. [Neutral]
- Bollinger Bands (20): Upper $12.27, lower $11.77, so price is in the lower half of the bands, about 29% of the way up from the lower band. The bands are narrowing after the decline, which points to a possible volatility squeeze. Price is below the midline (about $12.02) but has not broken the lower band. [Bearish]
- CMF (20): -0.316, strongly negative and falling sharply from positive readings in early November. This is heavy distribution and selling pressure. [Distribution]
- ADX (14): 28.4 with -DI at 24.9 over +DI at 15.8. The trend is strong and bearish. ADX has peaked near 30 and is rolling over slightly, and the -DI/+DI gap has narrowed from about 23 points to 9, so downside momentum is fading. [Strong Trend – Bearish]
- Volume: 3.86M, which looks average to below average compared with earlier spikes. The recent decline came with a few large red-volume bars (Nov 12 spike), and the latest bounce attempts are on light volume. [Bearish, no capitulation]
DIVERGENCES & TRENDS
- Price has made lower lows since the early-November peak near $12.80, and RSI, MACD and CMF all confirm the decline. There is no clear bullish divergence on RSI yet.
- MACD histogram has turned slightly positive while price is flat at $11.89–$11.96. This is an early sign of selling exhaustion, not a confirmed reversal.
- The -DI/+DI spread has been narrowing since Nov 12, and ADX is flat to slightly down. The trend is still bearish but losing steam.
- The Nov 12 gap down (close $12.26 → $11.99) was the main breakdown. Price has since consolidated in a tight $11.89–$11.96 band, which is below VWAP ($11.926) and below the EMAs.
- Price is below SMA50 ($12.56) and SMA200 ($13.28), and SMA50 is below SMA200 (death cross already in place). This is a long-term downtrend.
CHART PATTERNS
- The reference diagram's closest match is a Bearish Flag/Pennant continuation. Price dropped sharply on Nov 12, then built a small, tight sideways consolidation around $11.89–$11.96. The pattern is bearish if support at about $11.89 breaks, with a measured move of roughly the pole height ($12.26 → $11.90 = about $0.36), giving a target of about $11.55.
- The consolidation is also near the $11.69–$11.80 area, the lower Bollinger band and the prior October base, which could limit downside and act as support for a bounce.
- There is no confirmed reversal pattern (such as a double bottom) yet.
POTENTIAL SCENARIOS
- Scenario 1: Bearish Flag Breakdown Continuation — Price breaks the $11.89 range low, and distribution (CMF -0.32) and −DI dominance drive a push toward the lower Bollinger band and the October support zone. Trigger: close below $11.88 on rising volume. Target: $11.70–$11.75. Invalidation: close above $12.03 (EMA 13/band midline). (50% probability)
- Scenario 2: Neutral/Bullish Oversold Bounce — RSI near 30 and the fresh MACD cross trigger a relief rally toward the EMA 13 and VWAP-to-midline area, but the rally stalls under resistance. Trigger: reclaim of $11.97 on improving volume. Target: $12.03–$12.10. Invalidation: loss of $11.85. (35% probability)
- Scenario 3: Neutral Range Grind — Price stays pinned between $11.85 and $12.00 as ADX cools. Trigger: no break of either level. Target: $11.90–$11.95. Invalidation: a decisive close outside $11.80–$12.05. (15% probability)
PRICE TARGETS
For a 6-day timeframe the range width should be about 4–8% of the current price. The range is $11.50 to $12.15, a width of $0.65, which is 5.5% (within the guidance).
- Target Price: $11.78 (6 days)
- Expected Range: $11.50 to $12.15
- Key Levels: Support at $11.77 (lower Bollinger band), Resistance at $11.97 (EMA 13)
OVERALL BIAS
OVERALL BIAS: BEARISH - Price is below all key moving averages and VWAP, CMF shows heavy distribution (-0.32), and −DI leads with ADX near 28. The tight flag-like consolidation after the Nov 12 breakdown favors continuation toward the lower band, though the fresh MACD cross and near-oversold RSI argue for a possible bounce, so conviction is moderate.
This is educational analysis and not financial advice.