F 4-day bearish forecast — Nov 15, 2026
- Bias: Bearish
- Timeframe: 4 days (made Nov 15, 2026, target date Nov 18, 2026)
- Price at analysis: $11.91
- Price target: $11.82
- Expected range: $11.62 – $12.10
- Result: Pending — graded after the close on Nov 18, 2026
Get a free AI analysis of F today
Analysis
TECHNICAL INDICATORS
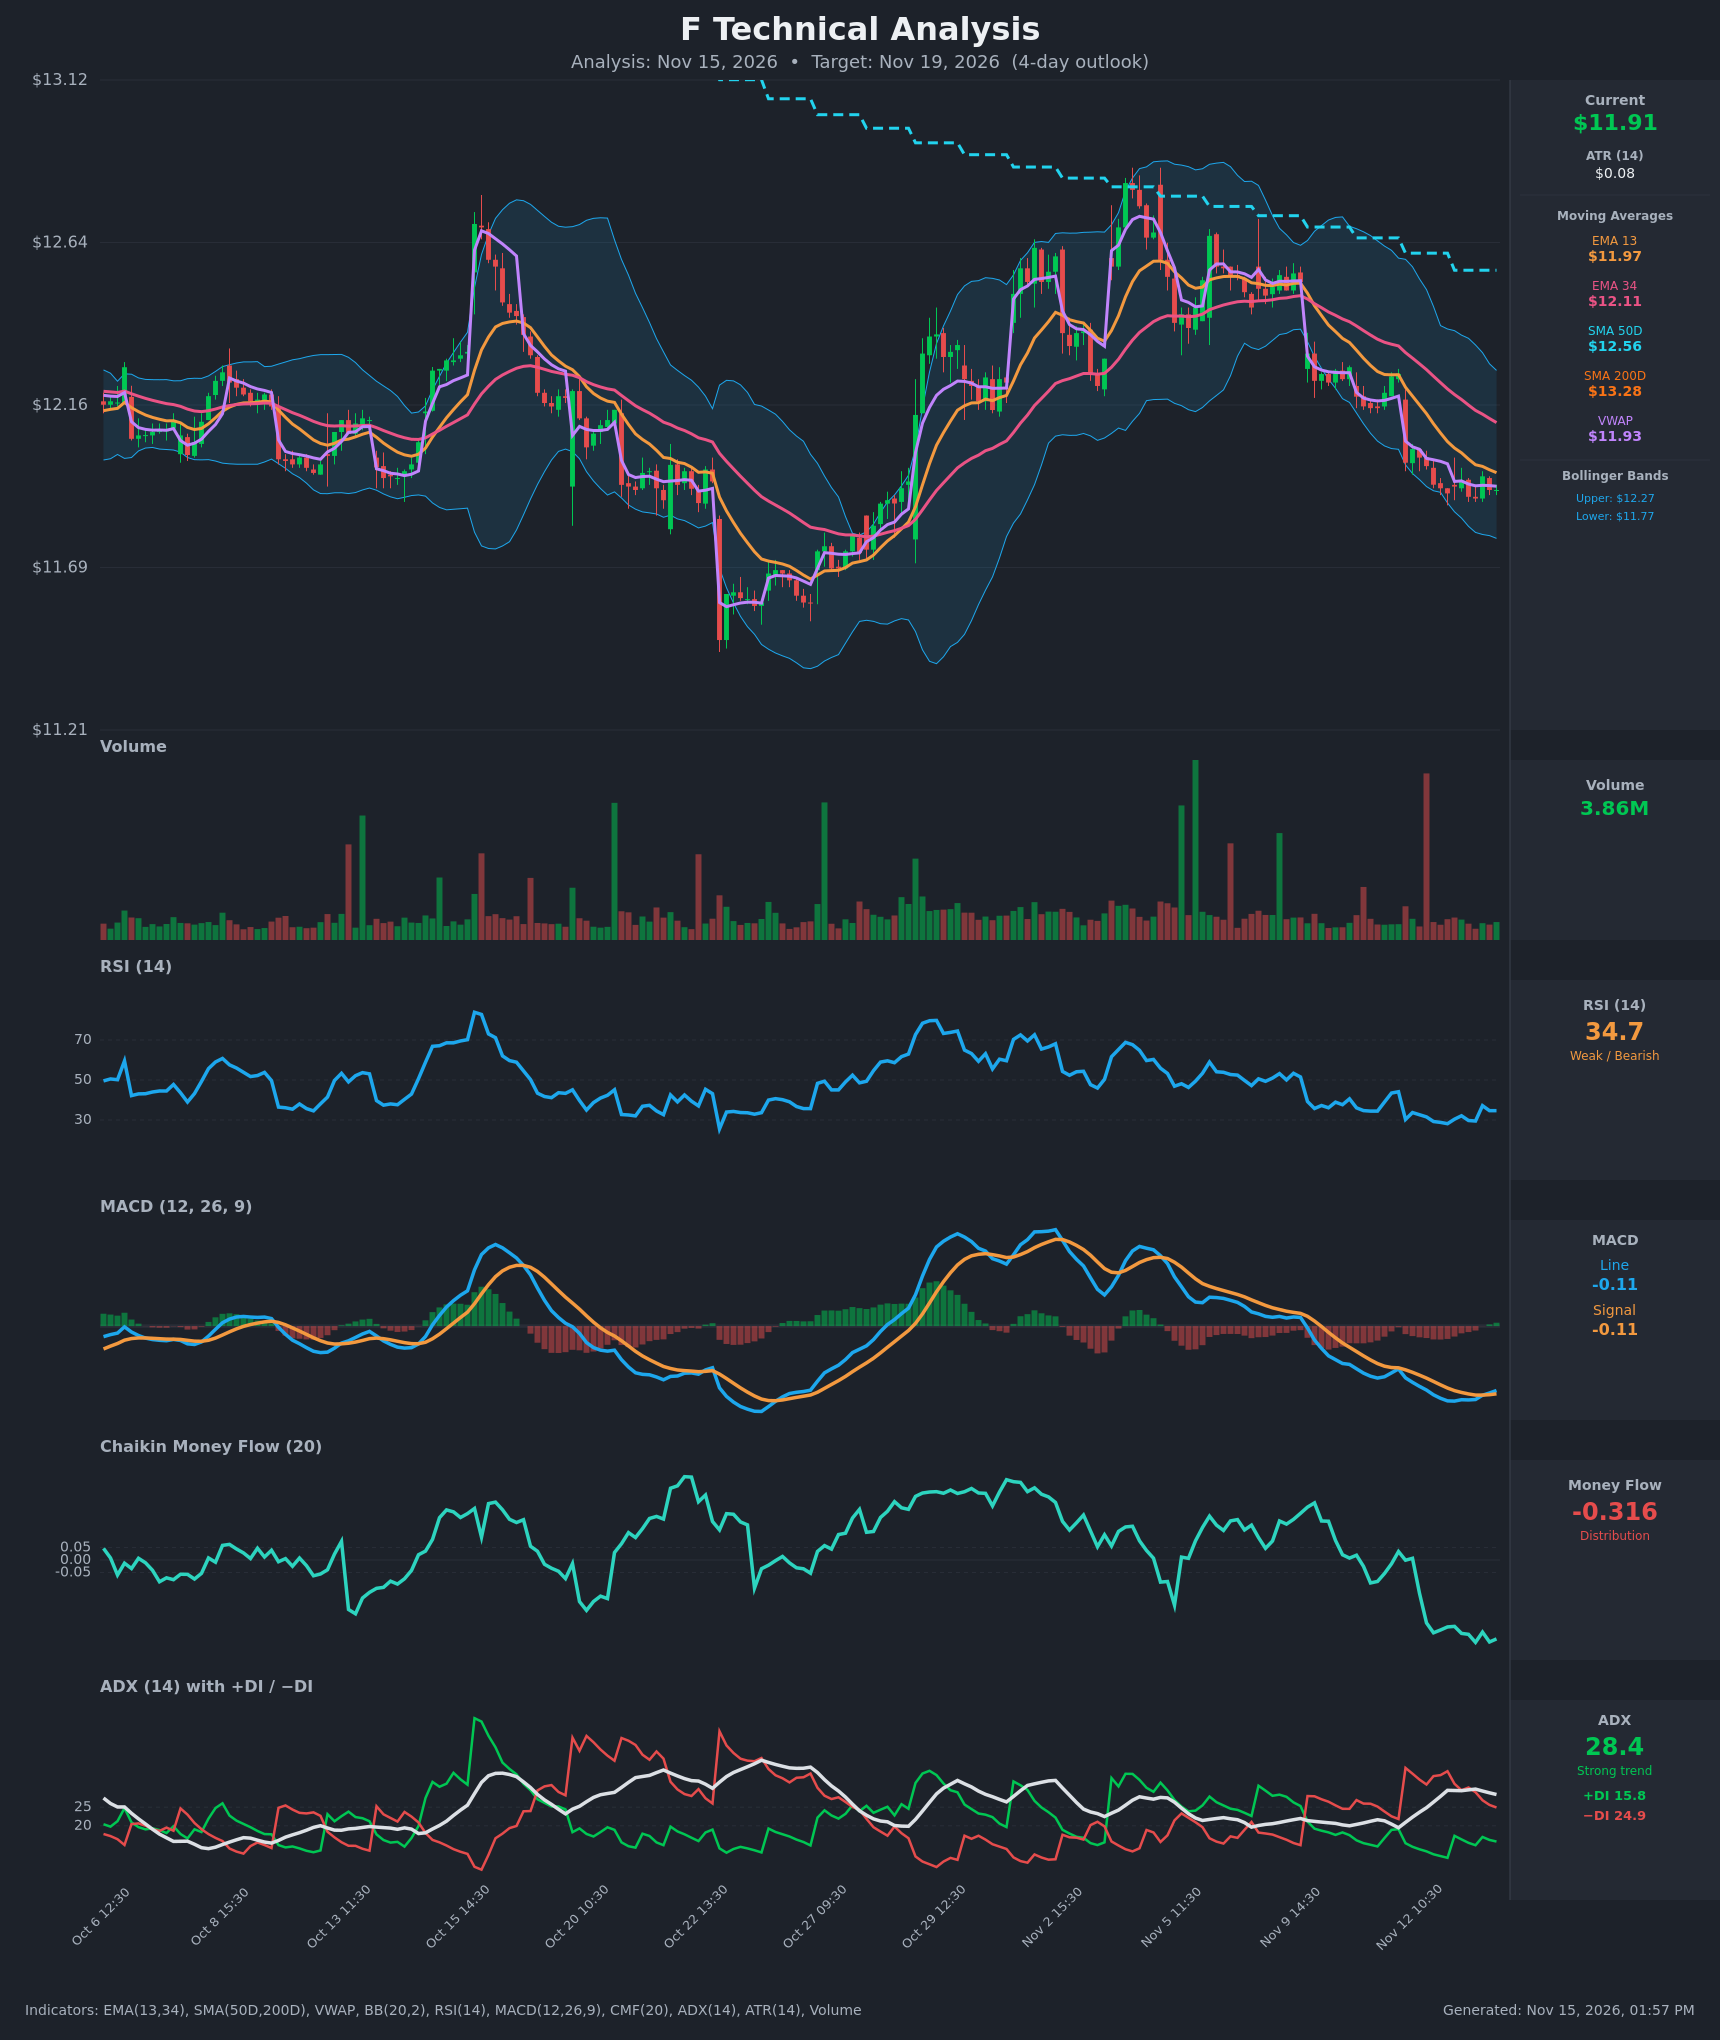
- RSI (14): 34.66, just above oversold (<30). It has been pinned in the 28–37 zone for the last two sessions and shows no bullish divergence yet. Momentum is weak, but the reading is stretched. [Bearish]
- 20 EMA: The chart shows EMA 13 at $11.97 and EMA 34 at $12.11. Price at $11.915 is below both, so they act as overhead resistance. EMA 13 is still declining and EMA 13 is below EMA 34, which is a bearish stack. [Bearish]
- MACD: The line is at -0.1073 and the signal at -0.1129. The line crossed back above the signal on Nov 13 at 13:30, so the histogram is slightly positive at about +0.006. The line has been rising for several bars, but both lines are below zero, so this is only a tentative bullish momentum turn. [Neutral]
- Bollinger Bands (20): The bands run from $11.77 to $12.27 with a midline near $12.02. Price at $11.915 sits in the lower third of the bands. The bands are narrowing after the decline, and the lower band has not been broken. That points to a possible bounce toward the midline, but price is walking the lower half. [Bearish]
- CMF (20): -0.316, deep in distribution territory. It has fallen steadily from positive readings in early November, a sign of persistent selling pressure. [Distribution]
- ADX (14): 28.4 with −DI at 24.9 over +DI at 15.8. This is a strong trend with bears in control. ADX is easing from 29.9, and the DI spread is narrowing (−DI was 35 on Nov 12), so selling momentum is fading. [Strong Trend – Bearish]
- Volume: 3.86M, average to slightly below average in the recent bars. There is no capitulation spike in the latest bars, only a heavy red bar on Nov 12 when the breakdown happened. [Neutral/Mildly Bearish]
DIVERGENCES & TRENDS
- Price is below EMA 13, EMA 34, SMA50D ($12.56) and SMA200D ($13.28). The SMA50D is below the SMA200D (death-cross configuration), so the long-term trend is bearish.
- The Nov 12 gap-down moved price out of the prior consolidation near $12.25–$12.60. Price has since compressed in a tight $11.89–$11.96 range over the last 8 bars.
- RSI made lower lows (about 28) while price made only marginally lower lows ($11.89–$11.90). This is flat, with no clear divergence.
- The MACD line is curling up toward the signal and has crossed it. This is an early sign of selling exhaustion, but it is still below zero.
- The DI spread is narrowing and ADX is flattening, so the downtrend is losing steam.
- VWAP ($11.926) is almost equal to price. Price is slightly below VWAP, a mild bearish tilt.
- CMF is at an extreme low, which hints at stretched selling but offers no reversal trigger.
CHART PATTERNS
- The broader structure is a Bearish Flag/Pennant-style continuation after the sharp drop from $12.26 to $11.90 on Nov 12. The tight sideways consolidation near $11.90 follows it. Measured-move downside is roughly $11.55–$11.70.
- Alternatively, the tight range near the lower Bollinger Band could be a base (Bullish Double Bottom at about $11.89) if price breaks above $11.97. That would need confirmation, and none is visible yet.
- There is no confirmed reversal pattern, and the dominant structure remains a downtrend with a pause.
POTENTIAL SCENARIOS
- Scenario 1: Bearish Continuation Lower — Price fails at EMA 13 and VWAP (~$11.93–$11.97), then breaks below the $11.89 range low. Distribution (CMF -0.32) and −DI dominance support further downside. Trigger: close below $11.88. Target: $11.65–$11.75. Invalidation: close above $12.02. (50% probability)
- Scenario 2: Neutral Range Chop Near Lows — Price keeps oscillating between $11.85 and $12.00 as the MACD turn and oversold RSI offset the weak trend. Trigger: no break of either boundary. Target: $11.90–$11.95. Invalidation: close outside $11.82–$12.02. (28% probability)
- Scenario 3: Bullish Oversold Bounce — The MACD cross, narrowing DI spread and RSI near oversold spark a relief rally toward the Bollinger midline and EMA 34. Trigger: close above $11.97 on rising volume. Target: $12.10–$12.15. Invalidation: close back below $11.85. (22% probability)
PRICE TARGETS
For a 4-day timeframe the range width should be about 3–5% of price, so roughly $0.40–$0.60. My range is $11.62 to $12.10, which is $0.48 wide, or 4.0%.
- Target Price: $11.82 (4-day)
- Expected Range: $11.62 to $12.10
- Key Levels: Support at $11.77 (lower Bollinger Band), Resistance at $11.97 (EMA 13 / VWAP area)
OVERALL BIAS
OVERALL BIAS: BEARISH - Price is below all key moving averages, with −DI over +DI at an ADX of 28.4, CMF at -0.32 (heavy distribution), and RSI weak in the low 30s. The fresh MACD cross and oversold conditions argue for a bounce risk, so the expected decline is modest, around $11.82.
This is educational analysis and not financial advice.