NFLX 4-day bearish forecast — Nov 15, 2026
- Bias: Bearish
- Timeframe: 4 days (made Nov 15, 2026, target date Nov 18, 2026)
- Price at analysis: $62.14
- Price target: $61.55
- Expected range: $60.20 – $63.00
- Result: Pending — graded after the close on Nov 18, 2026
Get a free AI analysis of NFLX today
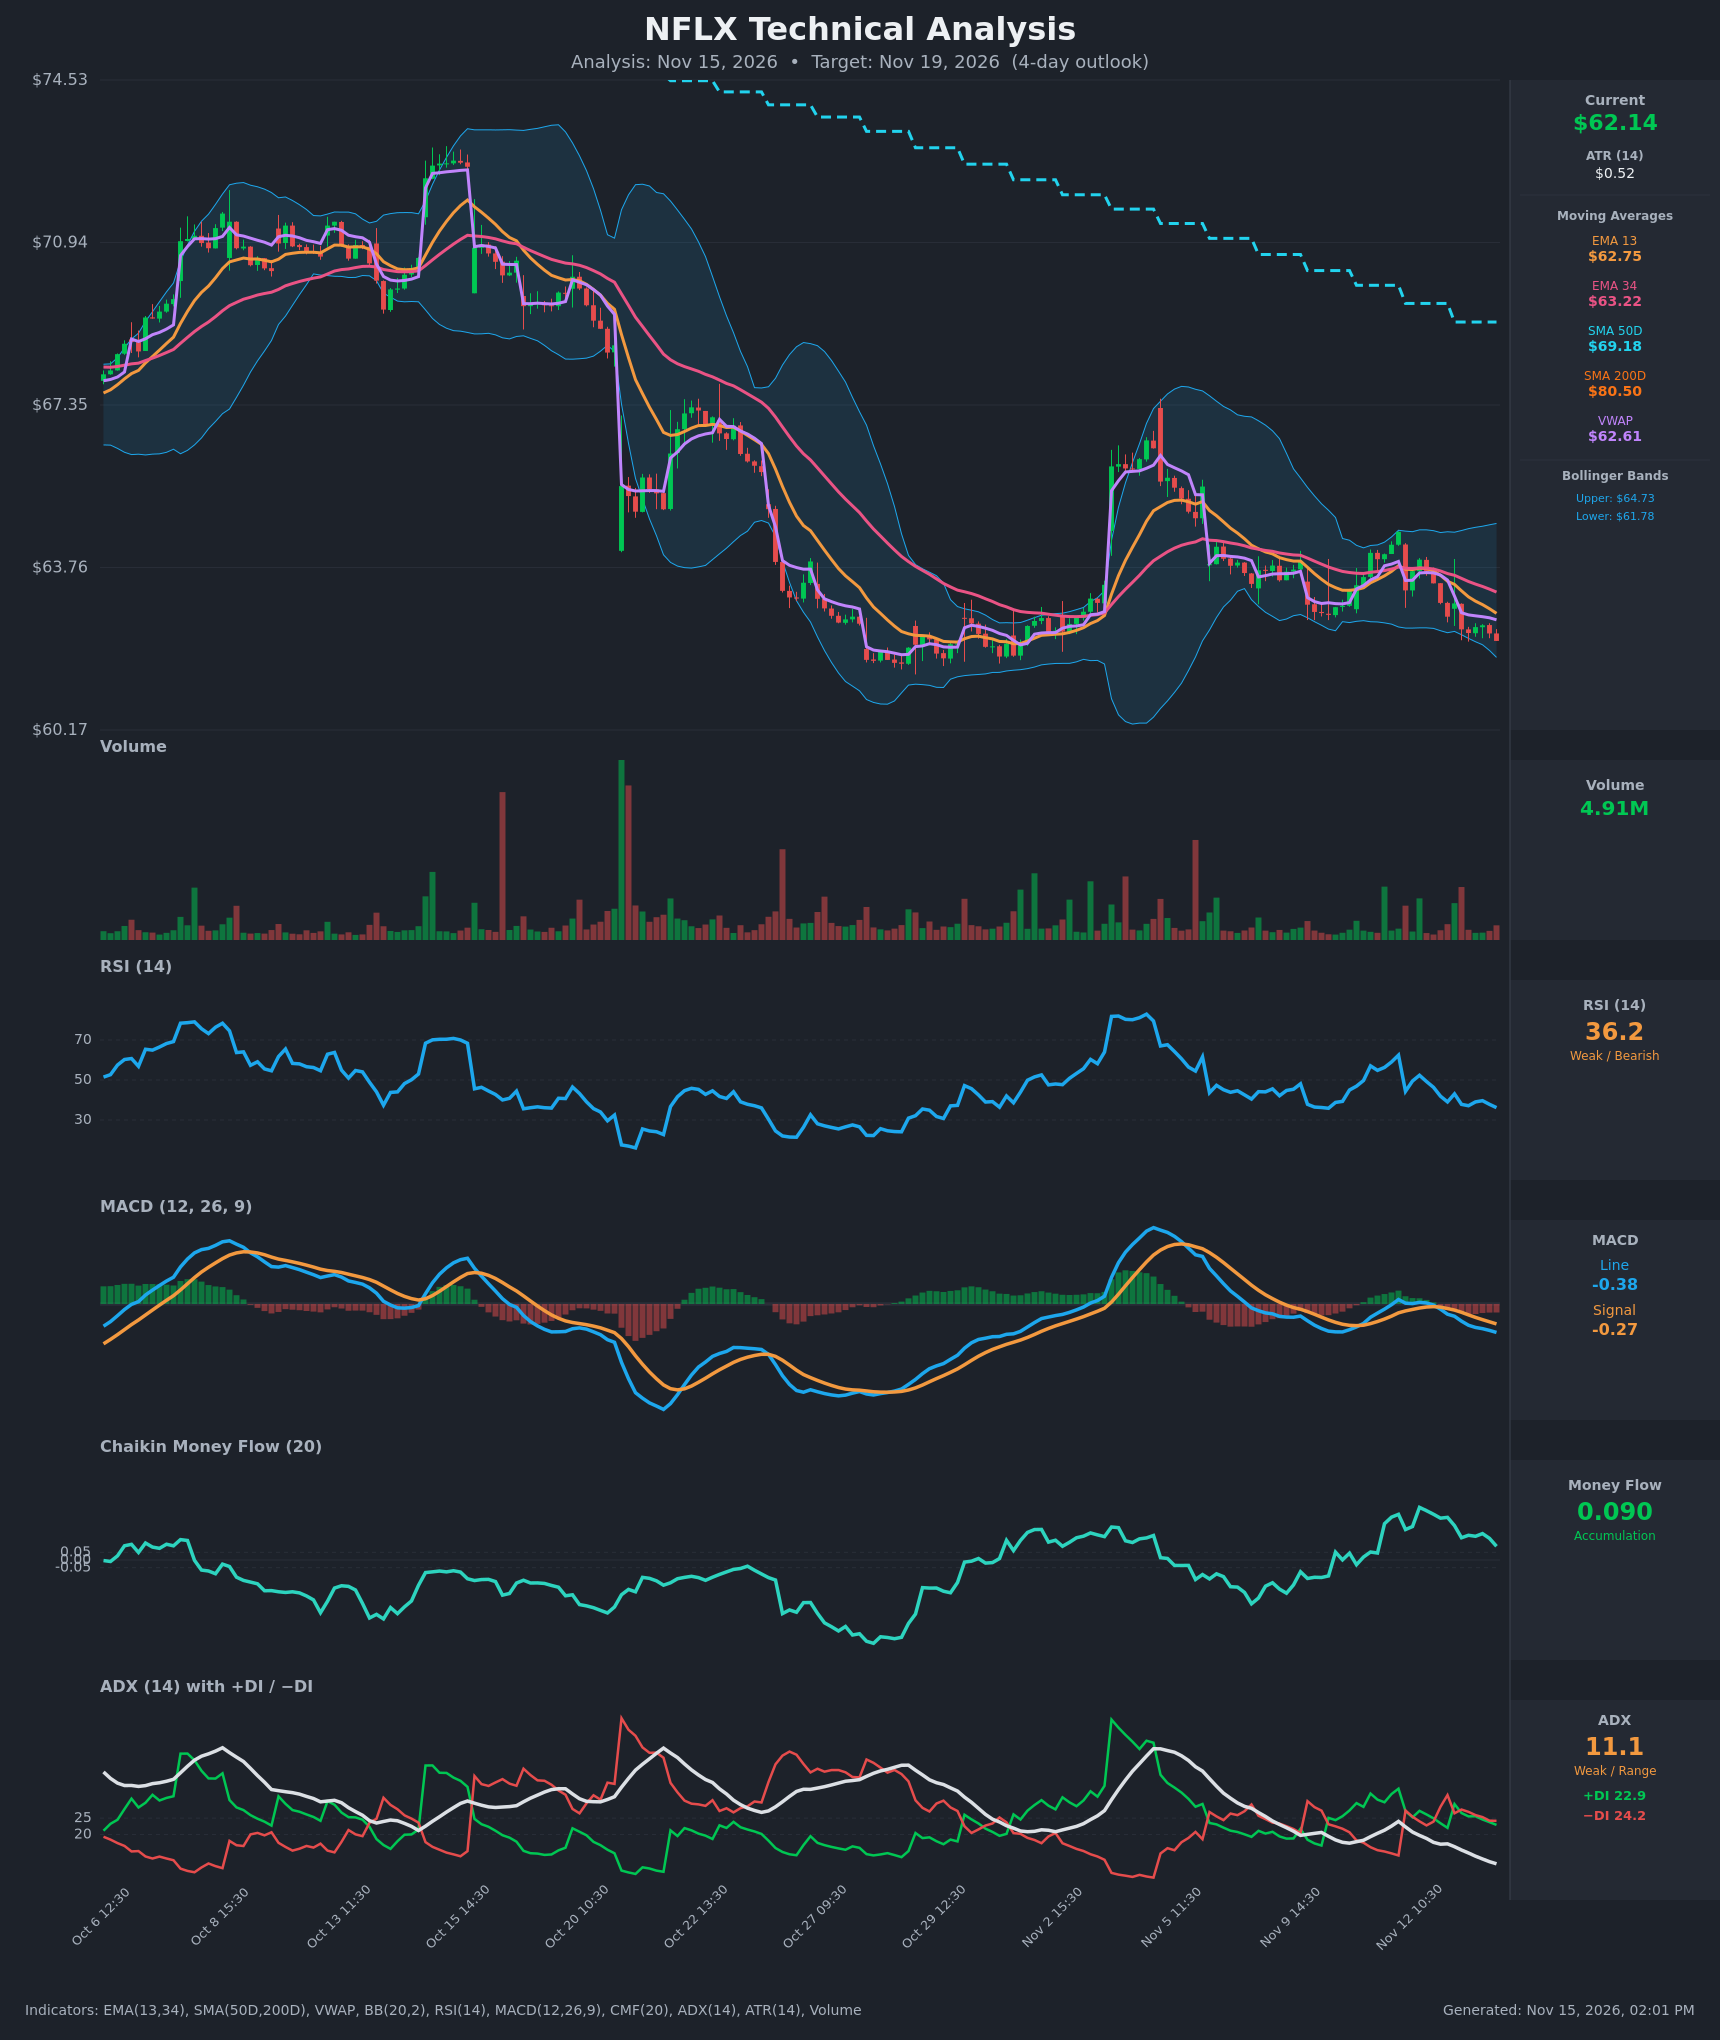
Analysis
TECHNICAL INDICATORS
- RSI (14): 36.18, down from 62 on Nov 11 and approaching oversold (30) without reaching it. Momentum is falling, with lower RSI highs through the week. [Bearish]
- 20 EMA: The chart shows EMA 13 ($62.75) and EMA 34 ($63.22). Price at $62.14 is below both, and EMA13 is below EMA34, a bearish cross that happened around Nov 12 14:30. Both averages are sloping down and act as overhead resistance. [Bearish]
- MACD: Line -0.383 is below signal -0.268 and widening, with a negative, expanding histogram. The bearish crossover came on Nov 12 at about 13:30. The line is only slightly below zero, so this is a modest downtrend rather than a deep one. [Bearish]
- Bollinger Bands (20): Upper $64.73, lower $61.78. Price is in the lower quarter of the bands, about $0.36 above the lower band. The bands are fairly narrow, and a walk along the lower band is plausible. [Bearish]
- CMF (20): 0.090, above the +0.05 threshold, so it still shows mild accumulation. It has faded from 0.34 to 0.09 over two sessions, which is a warning that buying pressure is waning. It conflicts with the price action. [Accumulation]
- ADX (14): 11.1 and falling, so there is no real trend. −DI (24.2) is marginally above +DI (22.9) and the two are nearly flat against each other, so there is only a slight bearish lean. [Weak Trend, slight bearish tilt]
- Volume: 4.91M, which is unremarkable. The recent down bars carry no capitulation-sized spikes, so there is no sign of an exhaustion low yet. The selling is orderly rather than panicked. [Neutral / mildly bearish]
DIVERGENCES & TRENDS
- Long-term structure: Price is well below SMA50D ($69.18) and SMA200D ($80.50), and SMA50D is below SMA200D. That is a death-cross regime and a long-term downtrend.
- VWAP: Price is below VWAP ($62.61), which signals sellers in control intraday.
- CMF divergence: CMF stays positive while price makes lower lows. This is a mild bullish divergence, but CMF is rolling over, so it carries little weight until price confirms.
- RSI and MACD: Both are trending lower with no bullish divergence. RSI is at 36 and has not made a washed-out reading.
- ADX: It has dropped to 11, which means chop. The Nov 5 spike has fully faded, and price has been grinding lower since Nov 11.
- Recent crossovers: The EMA13/EMA34 bearish cross, the MACD bearish cross and the −DI/+DI flip all occurred within the last two sessions.
CHART PATTERNS
- Bearish Flag / Descending Channel (loose match): After the sharp spike on about Nov 5 and the drop after it, price has made lower highs from $64.6 to $62.1. This resembles the bearish flag/pennant in the reference. The measured-move target from a break is well below, but that is outside the 4-day window.
- Lower-high range: The floor near $62.0-$62.3 is being tested. A close below it would be a continuation break, while the lower Bollinger Band at $61.78 is the nearest cushion.
- Context: The earlier base around $61.3-$62.0 (late Oct) is the next meaningful support. The overall structure is a downtrend, and the pattern is not clean.
POTENTIAL SCENARIOS
- Scenario 1: Bearish Continuation Lower — Price keeps making lower highs under the declining EMAs and VWAP, and tests the lower Bollinger Band and the late-October base. Trigger: hourly close below $61.78. Target: $61.30-$61.50. Invalidation: a close above $62.75 (EMA13). (50% probability)
- Scenario 2: Bullish Oversold Bounce — RSI near 36, price near the lower band and still-positive CMF set up a mean-reversion bounce toward the EMAs and VWAP. Trigger: reclaim of $62.60 (VWAP) with rising volume. Target: $63.20-$63.60. Invalidation: a close below $61.60. (30% probability)
- Scenario 3: Neutral Range Chop — With ADX at 11, price drifts sideways between $61.80 and $62.75. Trigger: no break of either level. Target: $62.00-$62.30. Invalidation: a close outside the $61.78-$62.75 range. (20% probability)
PRICE TARGETS
- Target Price: $61.55 (4-day horizon)
- Expected Range: $60.20 to $63.00 (width $2.80, about 4.5% of current price, wider than a 2-3 day range and tighter than a 7-10 day range)
- Key Levels: Support at $61.78, Resistance at $62.75
OVERALL BIAS
OVERALL BIAS: BEARISH - Price is below EMA13, EMA34 and VWAP, with a bearish MACD cross, falling RSI and −DI marginally above +DI, all within a long-term downtrend below the SMA50D and SMA200D. The positive but fading CMF and low ADX limit conviction, and a bounce from the lower band is a real risk.
This is educational analysis and not financial advice.