NFLX 6-day bearish forecast — Nov 15, 2026
- Bias: Bearish
- Timeframe: 6 days (made Nov 15, 2026, target date Nov 20, 2026)
- Price at analysis: $62.14
- Price target: $61.50
- Expected range: $60.30 – $63.50
- Result: Pending — graded after the close on Nov 20, 2026
Get a free AI analysis of NFLX today
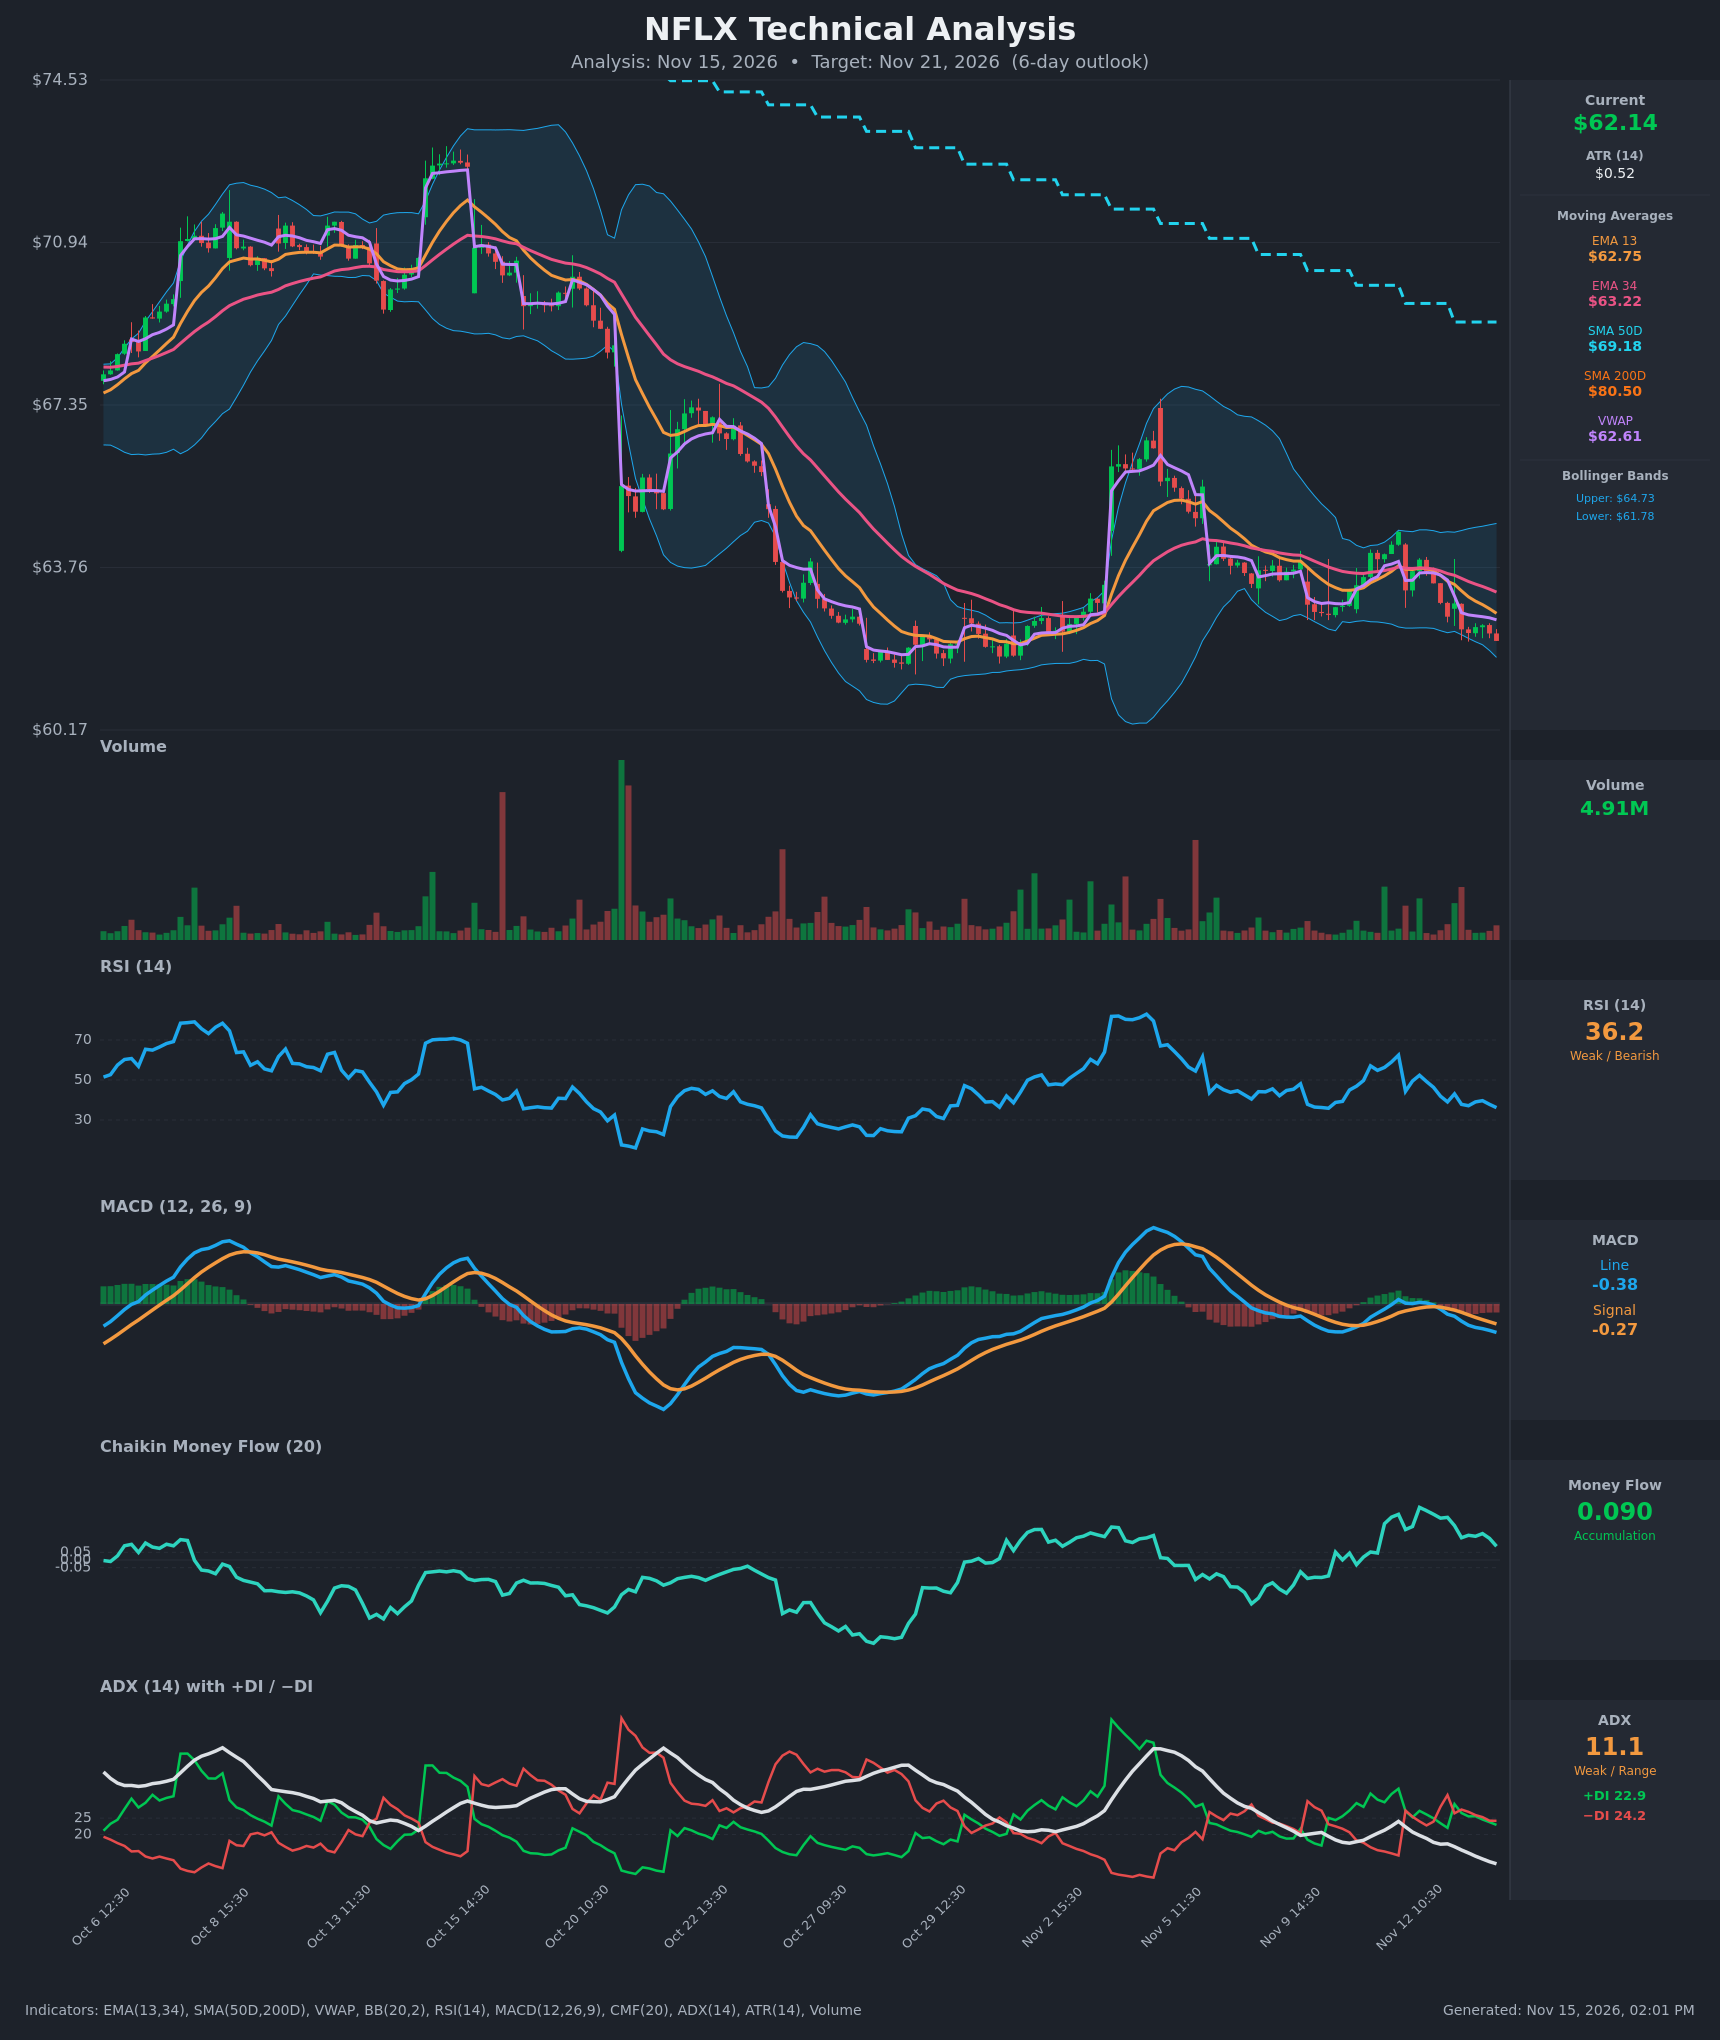
Analysis
TECHNICAL INDICATORS
- RSI (14): 36.18, down from 62.4 on Nov 11. It is making lower lows and is close to oversold (<30) but not there yet, so momentum is still pointing down. [Bearish]
- 20 EMA: Using EMA 13 at $62.75 and EMA 34 at $63.22, price ($62.14) is below both. EMA 13 is below EMA 34 and the gap is widening, so both act as overhead resistance. [Bearish]
- MACD: The line (-0.383) is below the signal (-0.268), both are negative, and the line crossed below the signal on Nov 12 (Nov 12 14:30). The gap has kept widening since, so the histogram is more negative. [Bearish]
- Bollinger Bands (20): Price is $62.14 against a lower band of $61.78 and an upper band of $64.73. It sits in the lower quarter of the bands, close to the lower band but not through it. The bands are fairly narrow (about 4.8% wide), so volatility is compressed. Price is walking down the lower half, which is bearish, but it is also stretched enough to allow a bounce. [Bearish]
- CMF (20): 0.090, above the +0.05 threshold, though off its Nov 12 reading of 0.34. Money flow is still positive even as price drifts lower, which is a mild bullish divergence, but the reading is fading. [Accumulation]
- ADX (14): 11.1 and falling, so there is no meaningful trend. −DI (24.2) is marginally above +DI (22.9), a very small bearish edge. [Weak Trend, slight bearish tilt]
- Volume: 4.91M on the latest bar, in line with the recent average. There are no capitulation or accumulation spikes, and the recent red bars are not on expanding volume. The drift lower is orderly, with no panic. [Neutral]
DIVERGENCES & TRENDS
- Moving-average structure: Price is below EMA 13, EMA 34, VWAP ($62.61), SMA 50D ($69.18) and SMA 200D ($80.50). The SMA 50D is well below the SMA 200D (a death-cross configuration), so the longer-term trend is firmly down.
- Short-term trend: EMA 13 crossed below EMA 34 around Nov 12 and the spread is widening (62.75 vs 63.22). Price has made lower highs since the Nov 11 close of $64.55.
- MACD: The bearish cross is confirmed and still deepening, with no sign of turning up.
- CMF divergence: CMF has stayed positive (0.09 to 0.34) while price fell from $64.55 to $62.14. This is a mild bullish divergence and could limit the downside, but CMF is rolling over.
- ADX: At 11.1 and falling, the market is range-bound, which makes any breakdown less reliable.
- Price vs. VWAP: Price is slightly below VWAP, so sellers have the intraday edge.
- Overall: Trend and momentum indicators lean bearish. Money flow leans bullish. The most direct evidence (price below every average, MACD under signal, −DI on top) favors the downside, but there is a real risk of an oversold bounce near the $61.40 support.
CHART PATTERNS
- Descending triangle / support test (bearish): Price has made lower highs since the Nov 5 spike to about $67. It has now given back the entire gap and is testing the flat support shelf at about $61.40–$62.00, the October 27–29 lows. A decisive close below that shelf would complete a descending-triangle-style breakdown, with a measured move toward the high-$50s. That is beyond the 6-day horizon, so only part of it is realistic.
- Bearish flag / lower-high drift: The pullback from the $64.5 area is a weak, low-ADX grind lower within a falling channel, consistent with a continuation of the downtrend.
- Counter-pattern: If the shelf holds, the setup resembles a possible double bottom (a bullish reversal) against the October lows. It would need a break above $63.22 (EMA 34) to confirm.
- Targets: Breakdown targets are about $60.50 first, then $59.50. A bounce target is about $63.20–$64.70 (EMA 34 to the upper Bollinger Band).
POTENTIAL SCENARIOS
- Scenario 1: Bearish Support Break and Drift Lower — Price stays under the EMAs and VWAP, MACD keeps widening, and sellers press the $61.40 shelf. Trigger: a close below $61.78 (lower Bollinger Band) and then $61.40. Target: $60.50 to $61.00. Invalidation: a close above $63.22 (EMA 34). (50% probability)
- Scenario 2: Bullish Oversold Bounce Off Support — RSI near 36 plus the positive CMF attract dip buyers, and the October base holds. Trigger: a hold above $61.40 and a reclaim of VWAP/EMA 13 at $62.60–$62.75. Target: $63.20 to $64.00. Invalidation: a close below $61.40. (35% probability)
- Scenario 3: Neutral Range Chop — Weak ADX keeps price pinned between $61.40 and $63.20 for the whole window. Trigger: failure to break either side. Target: $61.80 to $62.80. Invalidation: a close outside the $61.40–$63.20 range. (15% probability)
PRICE TARGETS
- Target Price: $61.50 (6-day horizon, about 1.0% below the current $62.14)
- Expected Range: $60.30 to $63.50 (width $3.20, about 5.2% of current price, consistent with the 4–8% guidance for a 7–10 day horizon, trimmed slightly for 6 days and compressed volatility; ATR of $0.52 supports roughly $3 of movement over 6 days)
- Key Levels: Support at $61.40, Resistance at $62.75
OVERALL BIAS
OVERALL BIAS: BEARISH - Price is below every moving average and VWAP, MACD is below its signal and widening, and −DI is marginally on top, so the path of least resistance is a drift toward or just below the $61.40 support. Conviction is modest because ADX is very weak, RSI is close to oversold, and CMF still shows accumulation, so a bounce from support is a real risk.
This is educational analysis and not financial advice.