GOOGL 6-day bullish forecast — Nov 15, 2026
- Bias: Bullish
- Timeframe: 6 days (made Nov 15, 2026, target date Nov 20, 2026)
- Price at analysis: $295.79
- Price target: $299.00
- Expected range: $290.50 – $306.50
- Result: Pending — graded after the close on Nov 20, 2026
Get a free AI analysis of GOOGL today
Analysis
TECHNICAL INDICATORS
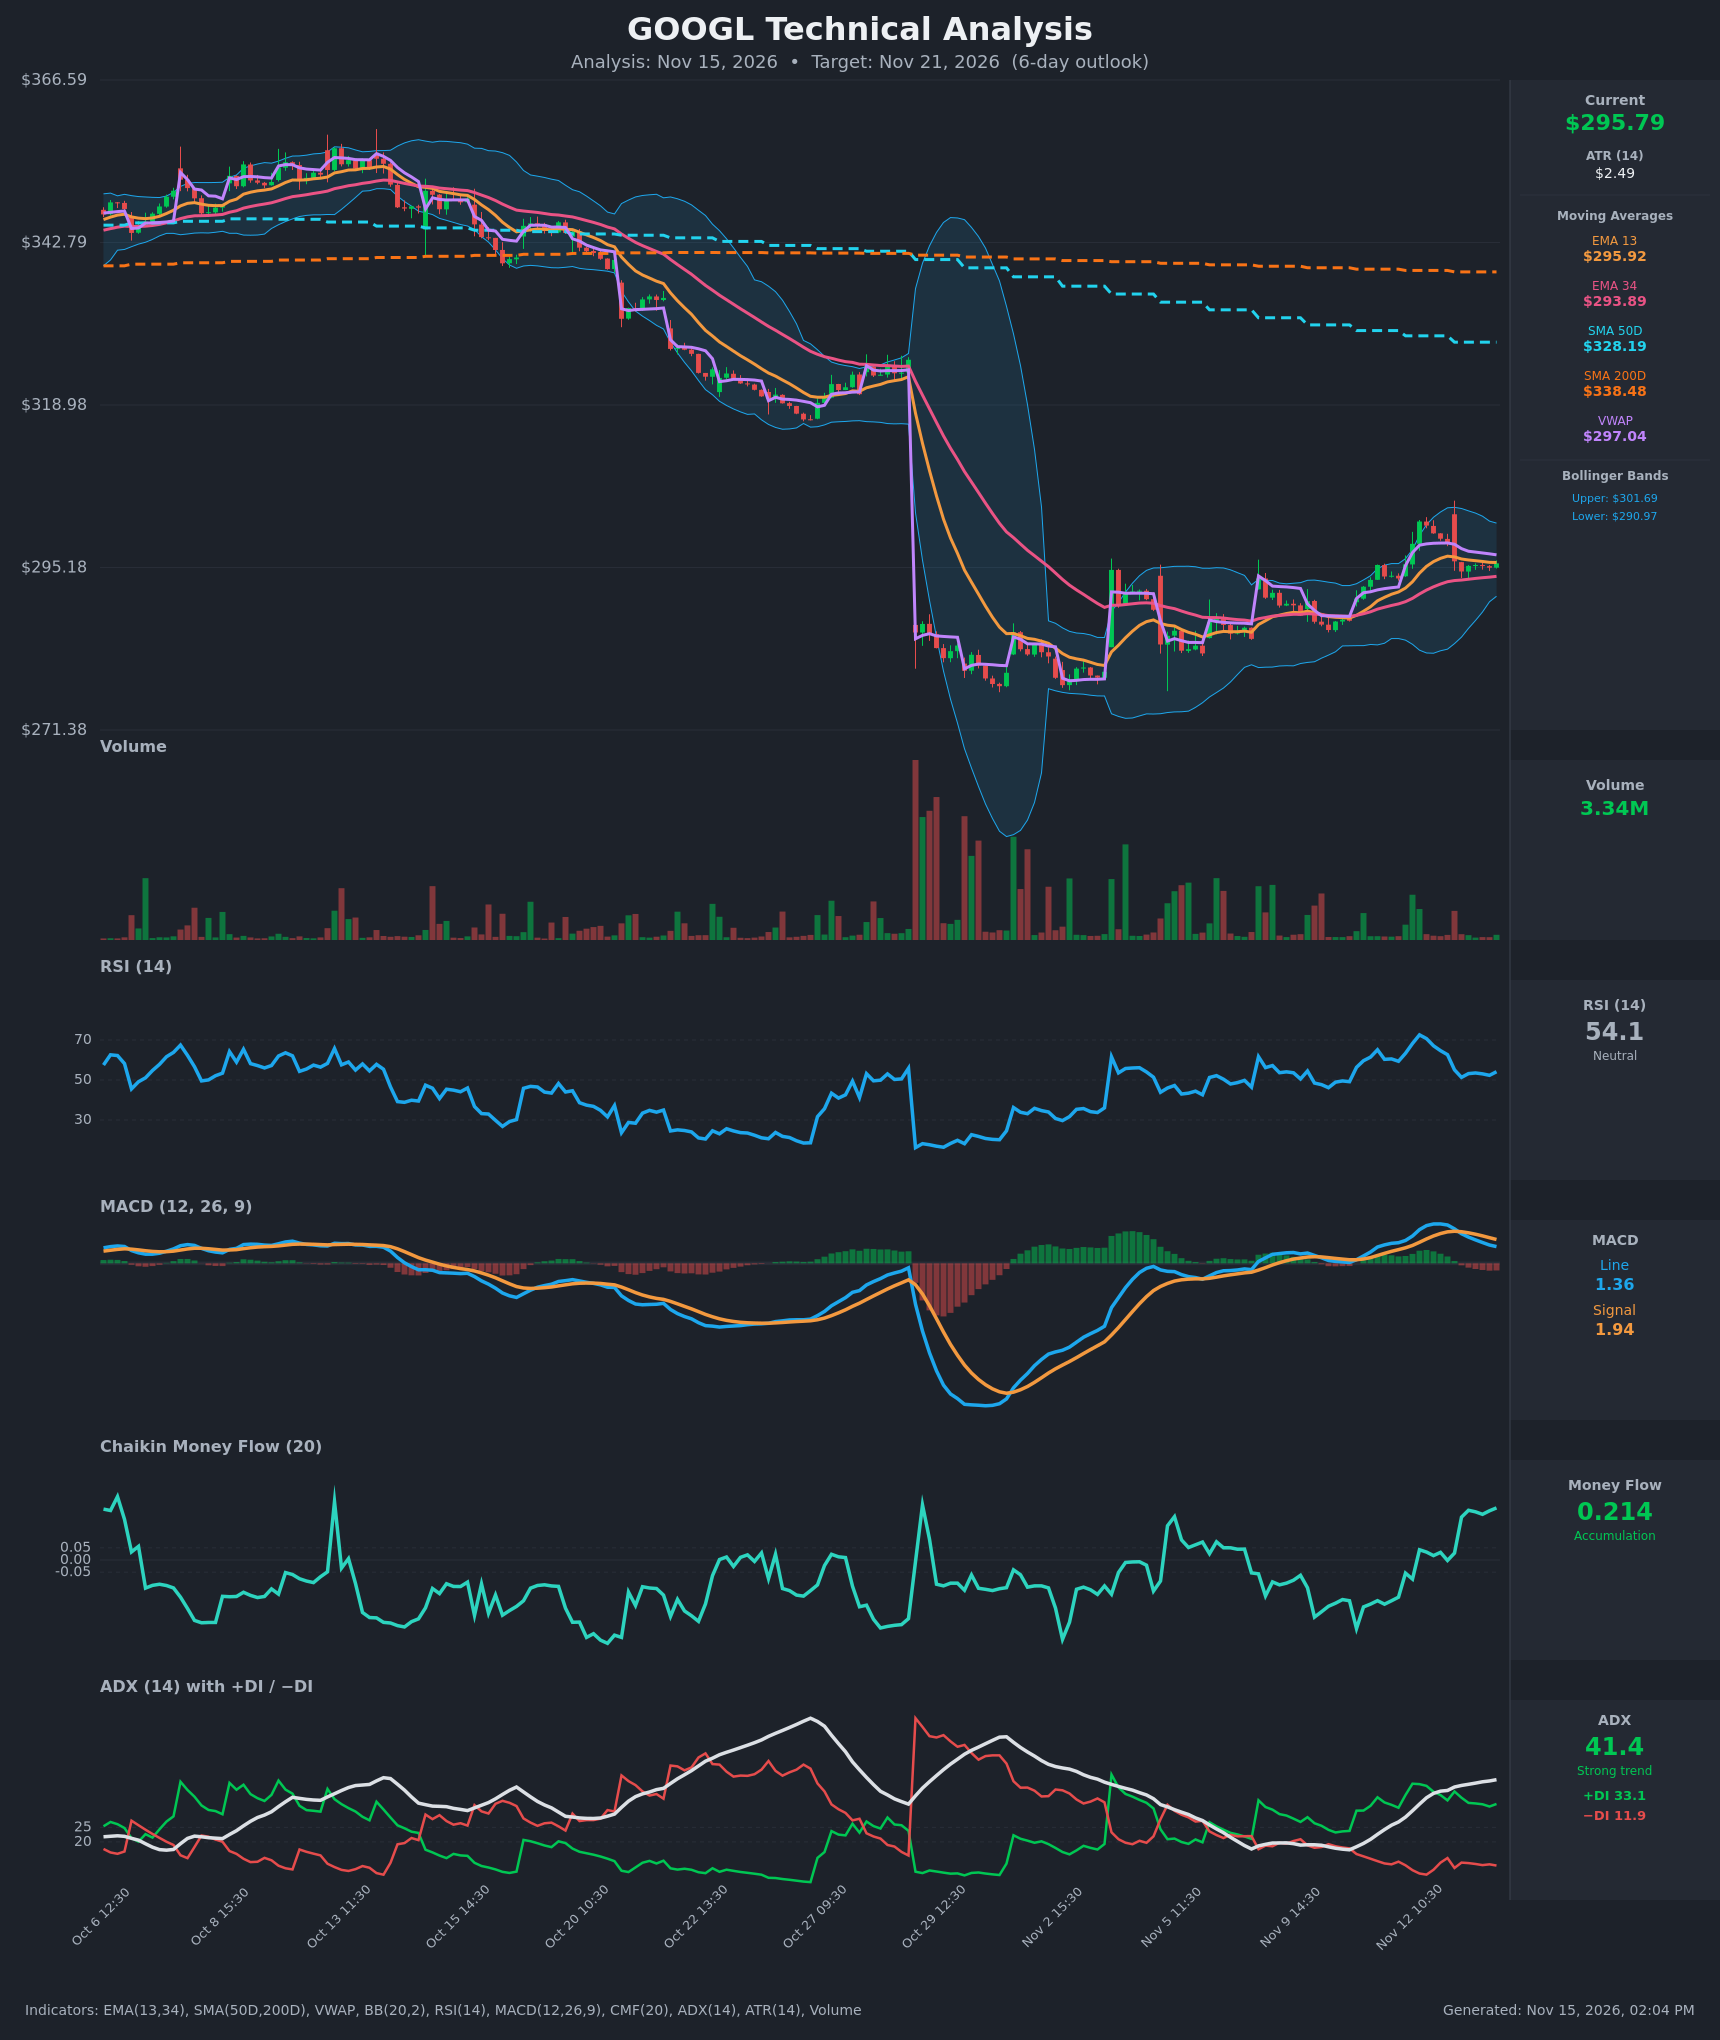
- RSI (14): 54.14. It has cooled from an overbought 72.6 on Nov 12 to a neutral zone and is flattening around 51-54 after finding a floor near 51. Momentum has reset without breaking down. [Neutral]
- 20 EMA (13/34 EMAs provided): EMA13 is $295.92 and EMA34 is $293.89. Price at $295.79 sits right on the EMA13 and above the EMA34. EMA13 remains above EMA34, so the short-term bullish alignment is intact. The EMA34 near $293.9 is the first dynamic support. [Bullish]
- MACD: Line 1.36 is below Signal 1.94, with a negative and widening histogram. The bearish crossover happened around Nov 13 10:30 and the line is still falling. This is a pullback in momentum, not yet a reversal, but it is a short-term negative. [Bearish]
- Bollinger Bands (20): Upper $301.69, lower $290.97, midline about $296.3. Price is near the midline. The bands have narrowed sharply from the volatile gap-down period, which points to compression and a coming volatility expansion. [Neutral]
- CMF (20): 0.214, well above +0.05 and rising since Nov 13 10:30. Buying pressure is strong despite the price pullback. [Accumulation]
- ADX (14): 41.4 and rising, with +DI 33.1 well above −DI 11.9. This is a strong trend with bulls clearly in control of the rebound off the ~$280 lows. [Strong Trend – Bullish]
- Volume: 3.34M, light on this consolidation, with no heavy distribution bars on the pullback. Volume spiked on the Oct 29 gap-down and has faded since, so the selling pressure looks exhausted. [Neutral to mildly Bullish]
Moving averages and VWAP:
- VWAP: $297.04, slightly above price, a minor near-term resistance.
- SMA50D: $328.19 and SMA200D: $338.48. Price is far below both, so the long-term trend is still bearish.
- SMA crossover: SMA50 is below SMA200 (a death cross already in place), a long-term headwind.
DIVERGENCES & TRENDS
- Price has pulled back from $301.9 to $295.8, and MACD has made a bearish crossover. CMF has risen to 0.214 over the same stretch, a bullish divergence between money flow and price.
- RSI is making lower highs (72.6 → 54), but it is holding above 50 rather than breaking down.
- The ADX rise from ~20 to 41 confirms that the rebound from the Oct 29 gap low is a real trend.
- The MACD histogram is falling, which warns of a possible further pause or dip toward the EMA34 or the lower BB before any continuation.
- Price remains well below the SMA50 and SMA200, so any rally faces a long-term downtrend overhead.
CHART PATTERNS
- Bullish Flag / Pennant (continuation): After the sharp advance from ~$280 to ~$302, price is consolidating in a tight, narrowing range of roughly $293-$302 on declining volume. This fits the Bullish Flag/Pennant from the reference. A breakout above ~$302 would project toward $305-$308, using the flagpole and a measured partial move.
- Larger context: Price is basing below a steep downtrend after a gap-down. This is a stabilization and recovery structure, not a confirmed reversal. Resistance sits at the $318-$320 gap area and then the SMA50.
- The consolidation could also resolve as a minor bearish rising wedge if $293 fails, but that is less likely given CMF and DI strength.
POTENTIAL SCENARIOS
- Scenario 1: Bullish Flag Breakout — Price holds the EMA34/$293.9 zone, MACD flattens, and buyers push through the recent high with CMF still in accumulation. Trigger: close above $301.7 (upper BB and recent high) on rising volume. Target: $305-$308. Invalidation: close below $292. (50% probability)
- Scenario 2: Neutral Range Consolidation — Price chops between the EMA34 and the upper BB while MACD resets and Bollinger Bands stay narrow. Trigger: failure to break either $293 or $302. Target: $294-$299. Invalidation: a decisive close outside $291-$303. (25% probability)
- Scenario 3: Bearish Pullback — The MACD bearish crossover extends and price loses the EMA34, then tests the lower band and the $285-$290 zone. Trigger: close below $293.9, then below $291. Target: $287-$290. Invalidation: reclaim of $298 (above VWAP). (25% probability)
PRICE TARGETS
For the 6-day timeframe (ATR $2.49, 6-day ATR move ≈ ±$6), the range width is about 5.4% of price, in line with the 4-8% guidance:
- Target Price: $299.00
- Expected Range: $290.50 to $306.50 (width $16.00 ≈ 5.4%)
- Key Levels: Support at $293.89 (EMA34, with the lower BB at $290.97 below it), Resistance at $301.69 (upper BB and recent high)
OVERALL BIAS
OVERALL BIAS: BULLISH - ADX at 41 with +DI far above −DI, CMF at 0.214, and price holding above the EMA34 in a tight flag-like consolidation favor an upside continuation. The negative MACD crossover and the overhead SMA50/200 limit conviction, so the expected gain is modest.
This is educational analysis and not financial advice.