GOOGL 4-day bullish forecast — Nov 15, 2026
- Bias: Bullish
- Timeframe: 4 days (made Nov 15, 2026, target date Nov 18, 2026)
- Price at analysis: $295.79
- Price target: $298.50
- Expected range: $290.50 – $302.50
- Result: Pending — graded after the close on Nov 18, 2026
Get a free AI analysis of GOOGL today
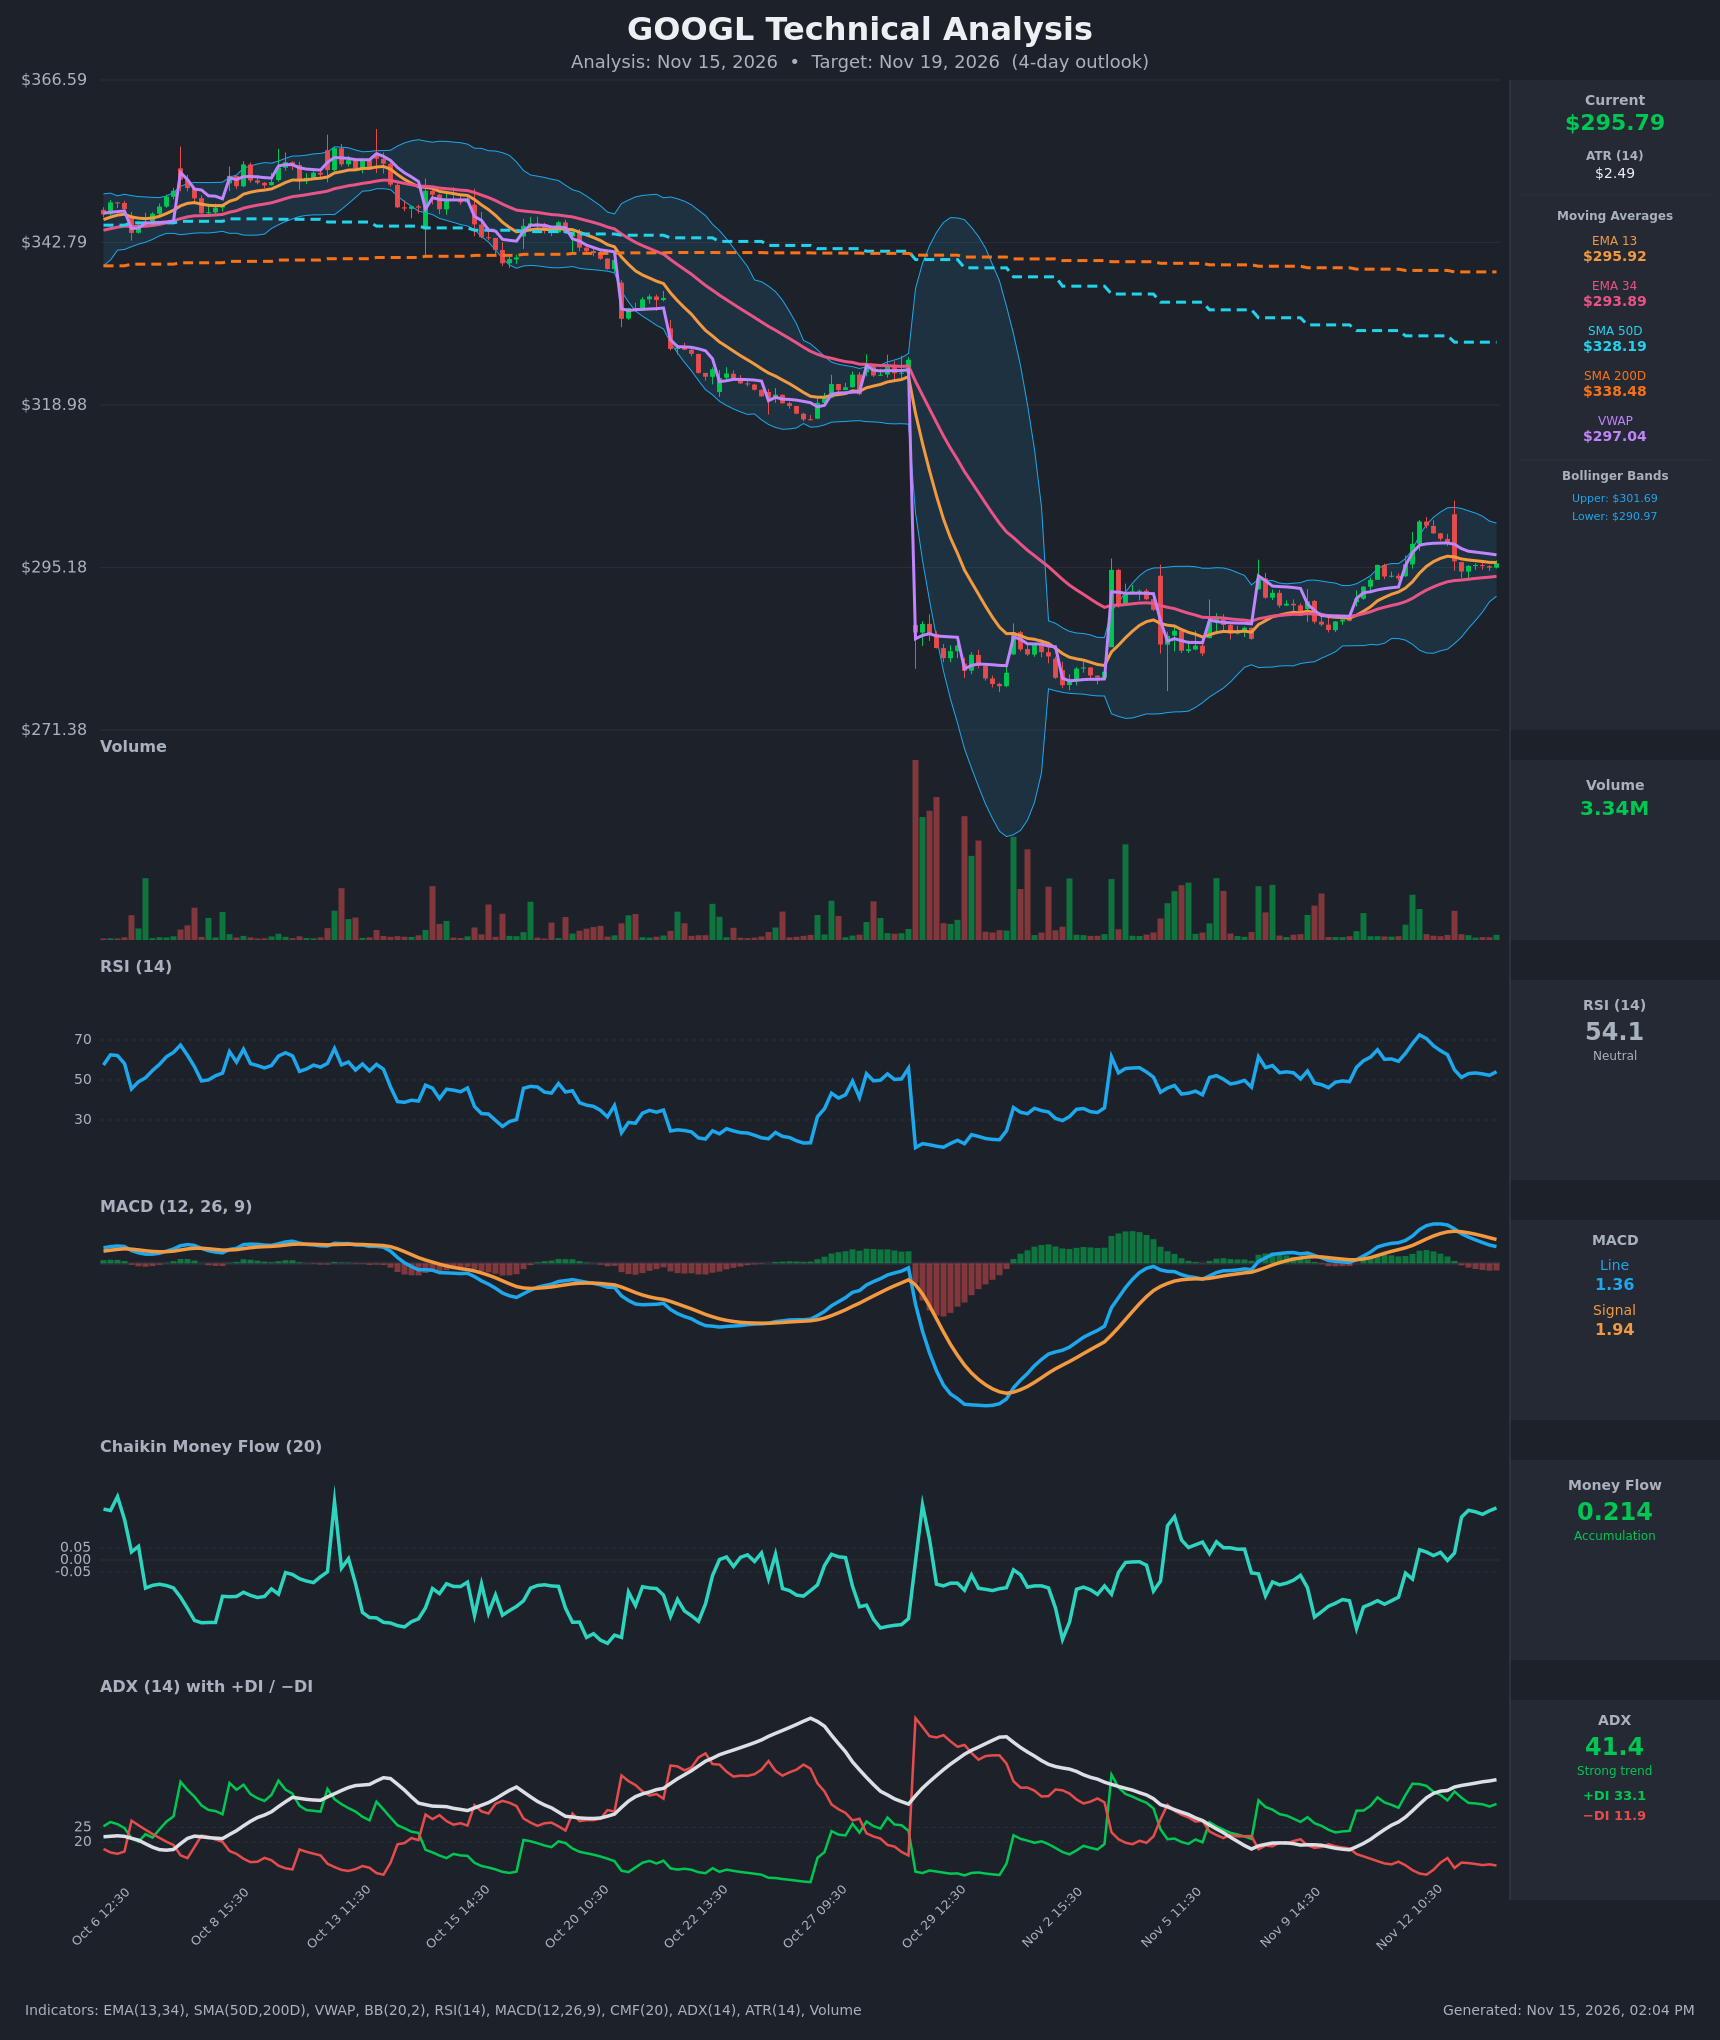
Analysis
TECHNICAL INDICATORS
- RSI (14): 54.14, down from an overbought 72.6 on Nov 12 and now back near the midline. Momentum has cooled but not turned bearish, and RSI is stabilizing around 51-54 over the last several bars. [Neutral]
- 20 EMA: The data gives EMA13 at $295.92 and EMA34 at $293.89. Price ($295.79) sits right on EMA13, which has flattened. EMA13 remains above EMA34, so the short-term trend is still up, and EMA34 is the first real support. [Bullish]
- MACD: Line 1.36 is below Signal 1.94, a bearish crossover that occurred around Nov 13 10:30. The histogram is negative and still falling. The line has dropped from a 3.21 peak, so short-term momentum is fading. [Bearish]
- Bollinger Bands (20): Upper $301.69, lower $290.97, with price just above the midline. The bands have started to widen from a tight squeeze, which fits a post-breakout consolidation. The Nov 12 push to $301.92 hit the upper band and was rejected. [Neutral]
- CMF (20): 0.214, well above the +0.05 threshold and rising since Nov 13. This is the clearest accumulation reading on the chart: buyers are absorbing the pullback. [Accumulation]
- ADX (14): 41.4 and rising, with +DI 33.1 far above −DI 11.9. This is a strong trend with bulls in control, so the recovery from the late-October low is intact. A high ADX after a sharp rally also means the trend is mature. [Strong Trend + Bullish]
- Volume: 3.34M, light and well below the heavy distribution volume of the late-October gap-down. The pullback from $301.9 to $295 came on quiet volume, which suggests a healthy pause rather than aggressive selling. [Neutral to mildly Bullish]
Other moving averages:
- VWAP: $297.04, just above price, so it acts as near-term resistance.
- SMA50D / SMA200D: $328.19 and $338.48, both far overhead. A death cross is already in place (SMA50 below SMA200), and price is well below both, so the long-term trend is still down.
DIVERGENCES & TRENDS
- MACD vs. price: MACD is rolling over while price holds flat around $295. This is a mild bearish momentum divergence, but it is consistent with a consolidation after a spike.
- RSI: RSI fell from 72.6 to about 54 while price lost only about 2%. The overbought condition has been worked off.
- CMF vs. price: CMF has been rising while price drifts sideways, a bullish divergence that suggests accumulation.
- ADX/DI: +DI stays dominant and no DI crossover is in sight. ADX has risen from below 20 to 41 during the recovery.
- EMA structure: EMA13 is above EMA34 and the gap is narrowing slowly. A flat EMA13 means a test of EMA34 near $293.9 is plausible before any continuation.
- MACD crossover: The bearish crossover is the main near-term warning. It can resolve through time (sideways) or through price (a dip).
- Long-term context: Price is about 10% below SMA50 and 13% below SMA200, so rallies face heavy overhead supply.
CHART PATTERNS
- Bullish Flag / Pennant (continuation): After the rally from about $280 to $302, price has pulled back into a tight, low-volume range of roughly $294-$297. A break above $297-$298 (VWAP and the flag top) would project toward the upper band at $301.7, and possibly $304-$305, which is the flagpole measured move.
- Bullish Double Bottom (reversal): The late-October and early-November lows near $279-$281 form a double bottom, with a neckline around $295-$297 that price is testing now. A sustained close above it would target the $305-$310 area, beyond this 4-day window.
- Caveat: The prior gap-down and the SMA50/SMA200 overhead keep this a recovery within a larger downtrend. A failure back below $293 would invalidate the flag and suggest a deeper retest of the lower band at $291.
POTENTIAL SCENARIOS
- Scenario 1: Bullish Flag Breakout and Continuation — Price holds EMA34 support, accumulation (CMF) persists, and MACD flattens and turns back up. Price reclaims VWAP and pushes toward the upper Bollinger Band. Trigger: hourly close above $297.50 (VWAP) with rising volume. Target: $301-$302. Invalidation: hourly close below $293.50. (50% probability)
- Scenario 2: Bearish Pullback Toward Support — The MACD bearish crossover plays out, price loses EMA13 and EMA34, and the market retests the lower band as the overhead SMA supply caps rallies. Trigger: hourly close below $293.50 on rising volume. Target: $290.50-$291.00. Invalidation: reclaim of $297.50. (30% probability)
- Scenario 3: Neutral Range-Bound Chop — Price oscillates between EMA34 and VWAP while MACD and RSI reset. Trigger: failure to break $297.50 or $293.50 in the first two days. Target: $293.50-$297.50. Invalidation: a decisive close outside the range. (20% probability)
PRICE TARGETS
- Target Price: $298.50 (4-day horizon, about +0.9%)
- Expected Range: $290.50 to $302.50. The width is $12.00, about 4.1% of the current price, which fits the 4-day guidance. It is wider than a 2-3 day range and narrower than a 7-10 day range.
- Key Levels: Support at $293.89 (EMA34), with $290.97 (lower Bollinger Band) below it. Resistance at $297.04 (VWAP), then $301.69 (upper Bollinger Band).
OVERALL BIAS
OVERALL BIAS: BULLISH - ADX at 41 with +DI far above −DI, CMF accumulation at 0.214, and EMA13 above EMA34 point to a continuation after the pause, with price holding at flag support. The MACD bearish crossover and the overhead SMA50/SMA200 limit upside, so conviction is modest and a dip toward $293-$294 is likely before any push toward $301.
This is educational analysis and not financial advice.