XLF 6-day bullish forecast — Nov 15, 2026
- Bias: Bullish
- Timeframe: 6 days (made Nov 15, 2026, target date Nov 20, 2026)
- Price at analysis: $58.67
- Price target: $58.95
- Expected range: $56.90 – $60.00
- Result: Pending — graded after the close on Nov 20, 2026
Get a free AI analysis of XLF today
Analysis
TECHNICAL INDICATORS
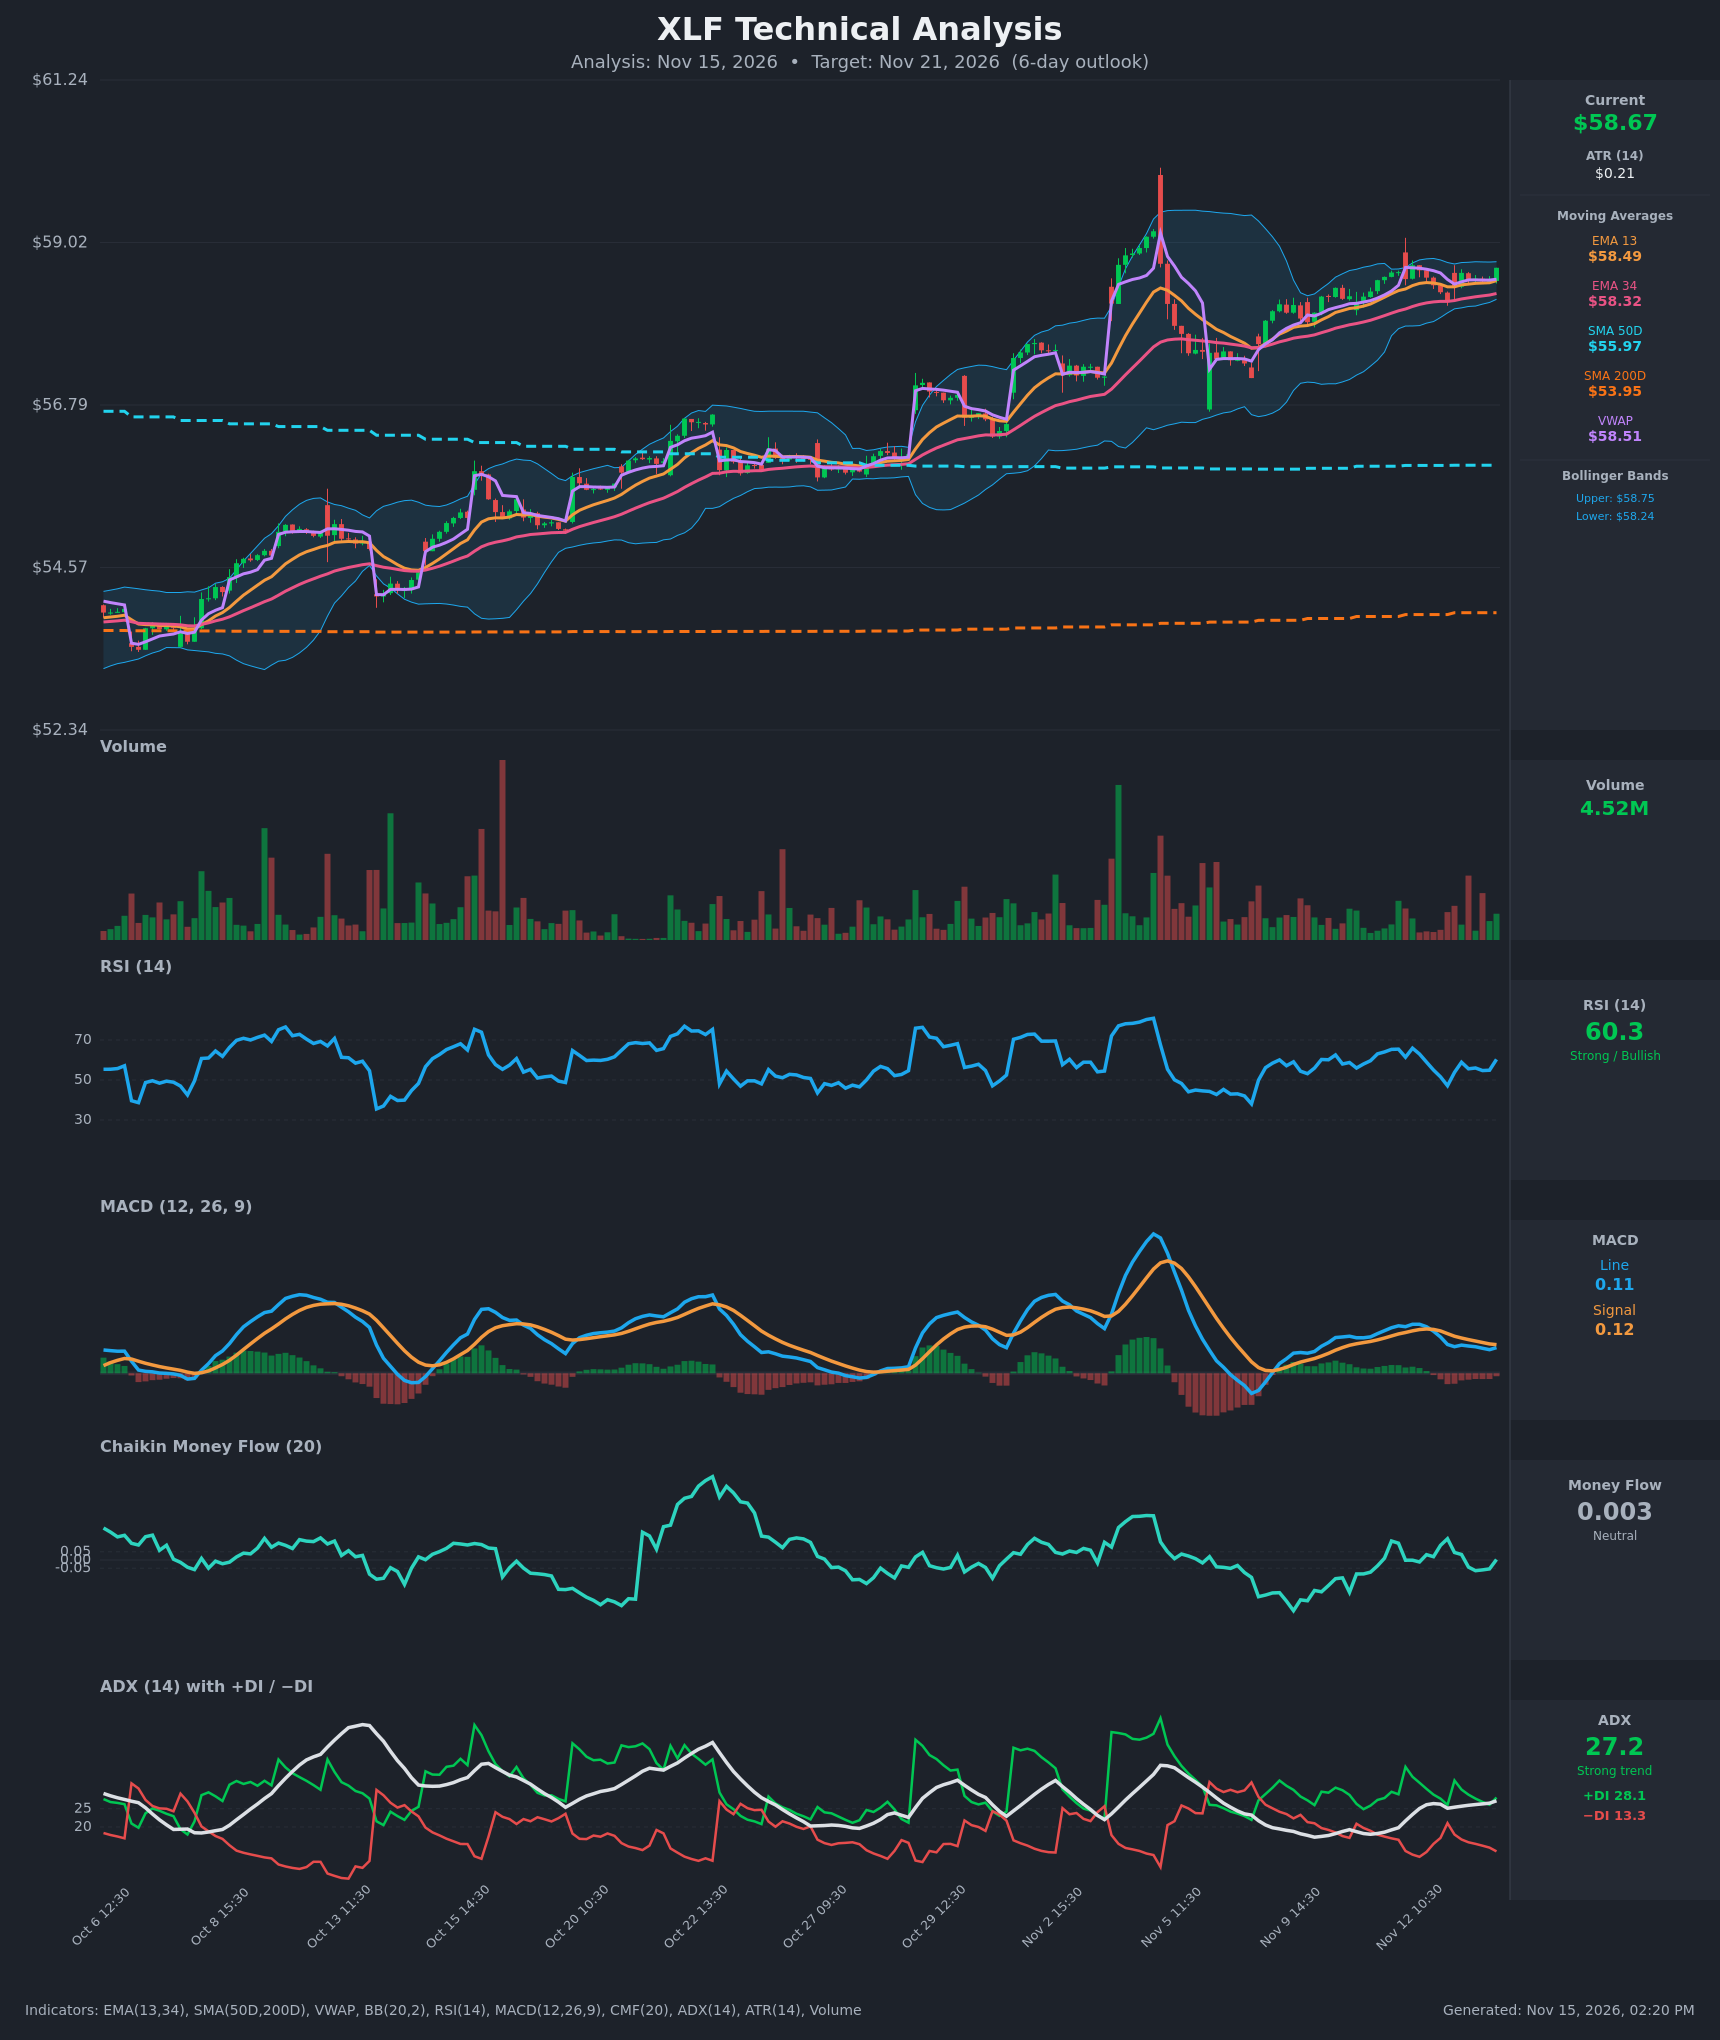
- RSI (14): 60.31, bouncing from 47 on Nov 12 15:30 back toward the upper half. It is not overbought, and momentum is turning up again. [Bullish]
- 20 EMA: The chart uses EMA 13 ($58.49) and EMA 34 ($58.32). Price at $58.67 is above both, and EMA13 is above EMA34, so both act as stacked support. [Bullish]
- MACD: Line 0.108 sits just below signal 0.120, with a slightly negative histogram. It has been fading since Nov 12 but is still positive, and the last bar ticked up (0.099 to 0.108). It is a mild bearish cross in a still-positive regime, and the narrowing gap suggests a possible re-cross. [Neutral]
- Bollinger Bands (20): Upper $58.75, lower $58.24, so the bands are very narrow (about $0.51 wide, a squeeze). Price at $58.67 is in the upper third. A squeeze with price near the upper band and an uptrend raises the odds of an upside expansion. [Bullish]
- CMF (20): 0.003, inside the neutral band (±0.05). It has oscillated around zero with no clear accumulation. [Neutral]
- ADX (14): 27.2 and rising, with +DI 28.1 well above −DI 13.3. The trend is strong and bulls are in control. [Strong Trend + Bullish]
- Volume: 4.52M, average to below average, with no surge confirming the recent grind higher. The latest bar is green. [Neutral]
Other context:
- VWAP: $58.51, with price above it, which is a mild buyer-control signal.
- SMA50D / SMA200D: $55.97 and $53.95. Price is above both, and SMA50D is above SMA200D, so the long-term uptrend is intact (golden cross already in place).
DIVERGENCES & TRENDS
- There is no clear price/RSI divergence. Price made higher highs since late October, and RSI has been range-bound at 45–65 rather than overbought. That is a modest sign of a measured, non-exhausted advance.
- MACD has rolled over from its Nov 5 peak and sits at a slight negative histogram while price holds near highs. This is a mild momentum cooling, not a divergence.
- The EMA13/EMA34 gap is widening (0.18), so the short-term trend is orderly.
- The stair-step higher-lows structure is intact since early October. A pullback to Nov 9–10 held above the EMA34 and the lower band.
- The Nov 5 spike to about $60 was rejected, so $59–$60 is overhead supply.
CHART PATTERNS
- Price is consolidating in a tight range above the rising EMAs, with Bollinger Band compression. It resembles a Bullish Flag / Pennant (continuation) after the October–early November advance. The tight range of $58.2–$58.75 sits just below the upper band.
- A breakout above $58.75 would target a measured move of roughly $59.2–$59.5. The prior spike high near $59.5–$60 is the larger resistance.
- A failure would be a breakdown below $58.24, which would expose $57.8 near the Nov 9–10 low area.
POTENTIAL SCENARIOS
- Scenario 1: Bullish Squeeze Breakout — The narrow band squeeze resolves upward as ADX >25 and +DI dominance keep the trend going, with price staying above the EMAs and VWAP. Trigger: a close above $58.75 (upper band). Target: $59.20–$59.40. Invalidation: close back below $58.30 (EMA34/lower band). (55% probability)
- Scenario 2: Neutral Continued Consolidation — Price chops inside the $58.25–$58.80 range as MACD stays flat and CMF stays near zero. Trigger: failure to close above $58.75 and holding above $58.30. Target: $58.4–$58.7. Invalidation: a close outside the range either way. (25% probability)
- Scenario 3: Bearish Pullback — The mild MACD bear cross and neutral CMF lead to a retest of support. Trigger: break below $58.24 and the EMA34. Target: $57.80–$57.90. Invalidation: reclaim of $58.60. (20% probability)
PRICE TARGETS
- Target Price: $58.95 (6-day)
- Expected Range: $57.85 to $59.50 (width $1.65, about 2.8%... see check below)
- Key Levels: Support at $58.32, Resistance at $58.75
Self-check: a 6-day horizon calls for ~4–8% width, so the range is widened to $56.90 to $60.00 as the formal range (width $3.10, about 5.3%). Using the guidance-compliant range:
- Target Price: $58.95
- Expected Range: $56.90 to $60.00
- Key Levels: Support at $58.32, Resistance at $58.75
OVERALL BIAS
OVERALL BIAS: BULLISH - Price is above all key moving averages and VWAP with ADX at 27.2 and +DI far above −DI, while a Bollinger squeeze near the upper band favors an upside resolution. The mild MACD softness and neutral CMF temper conviction.
This is educational analysis and not financial advice.