XLF 4-day bullish forecast — Nov 15, 2026
- Bias: Bullish
- Timeframe: 4 days (made Nov 15, 2026, target date Nov 18, 2026)
- Price at analysis: $58.67
- Price target: $59.00
- Expected range: $57.65 – $59.70
- Result: Pending — graded after the close on Nov 18, 2026
Get a free AI analysis of XLF today
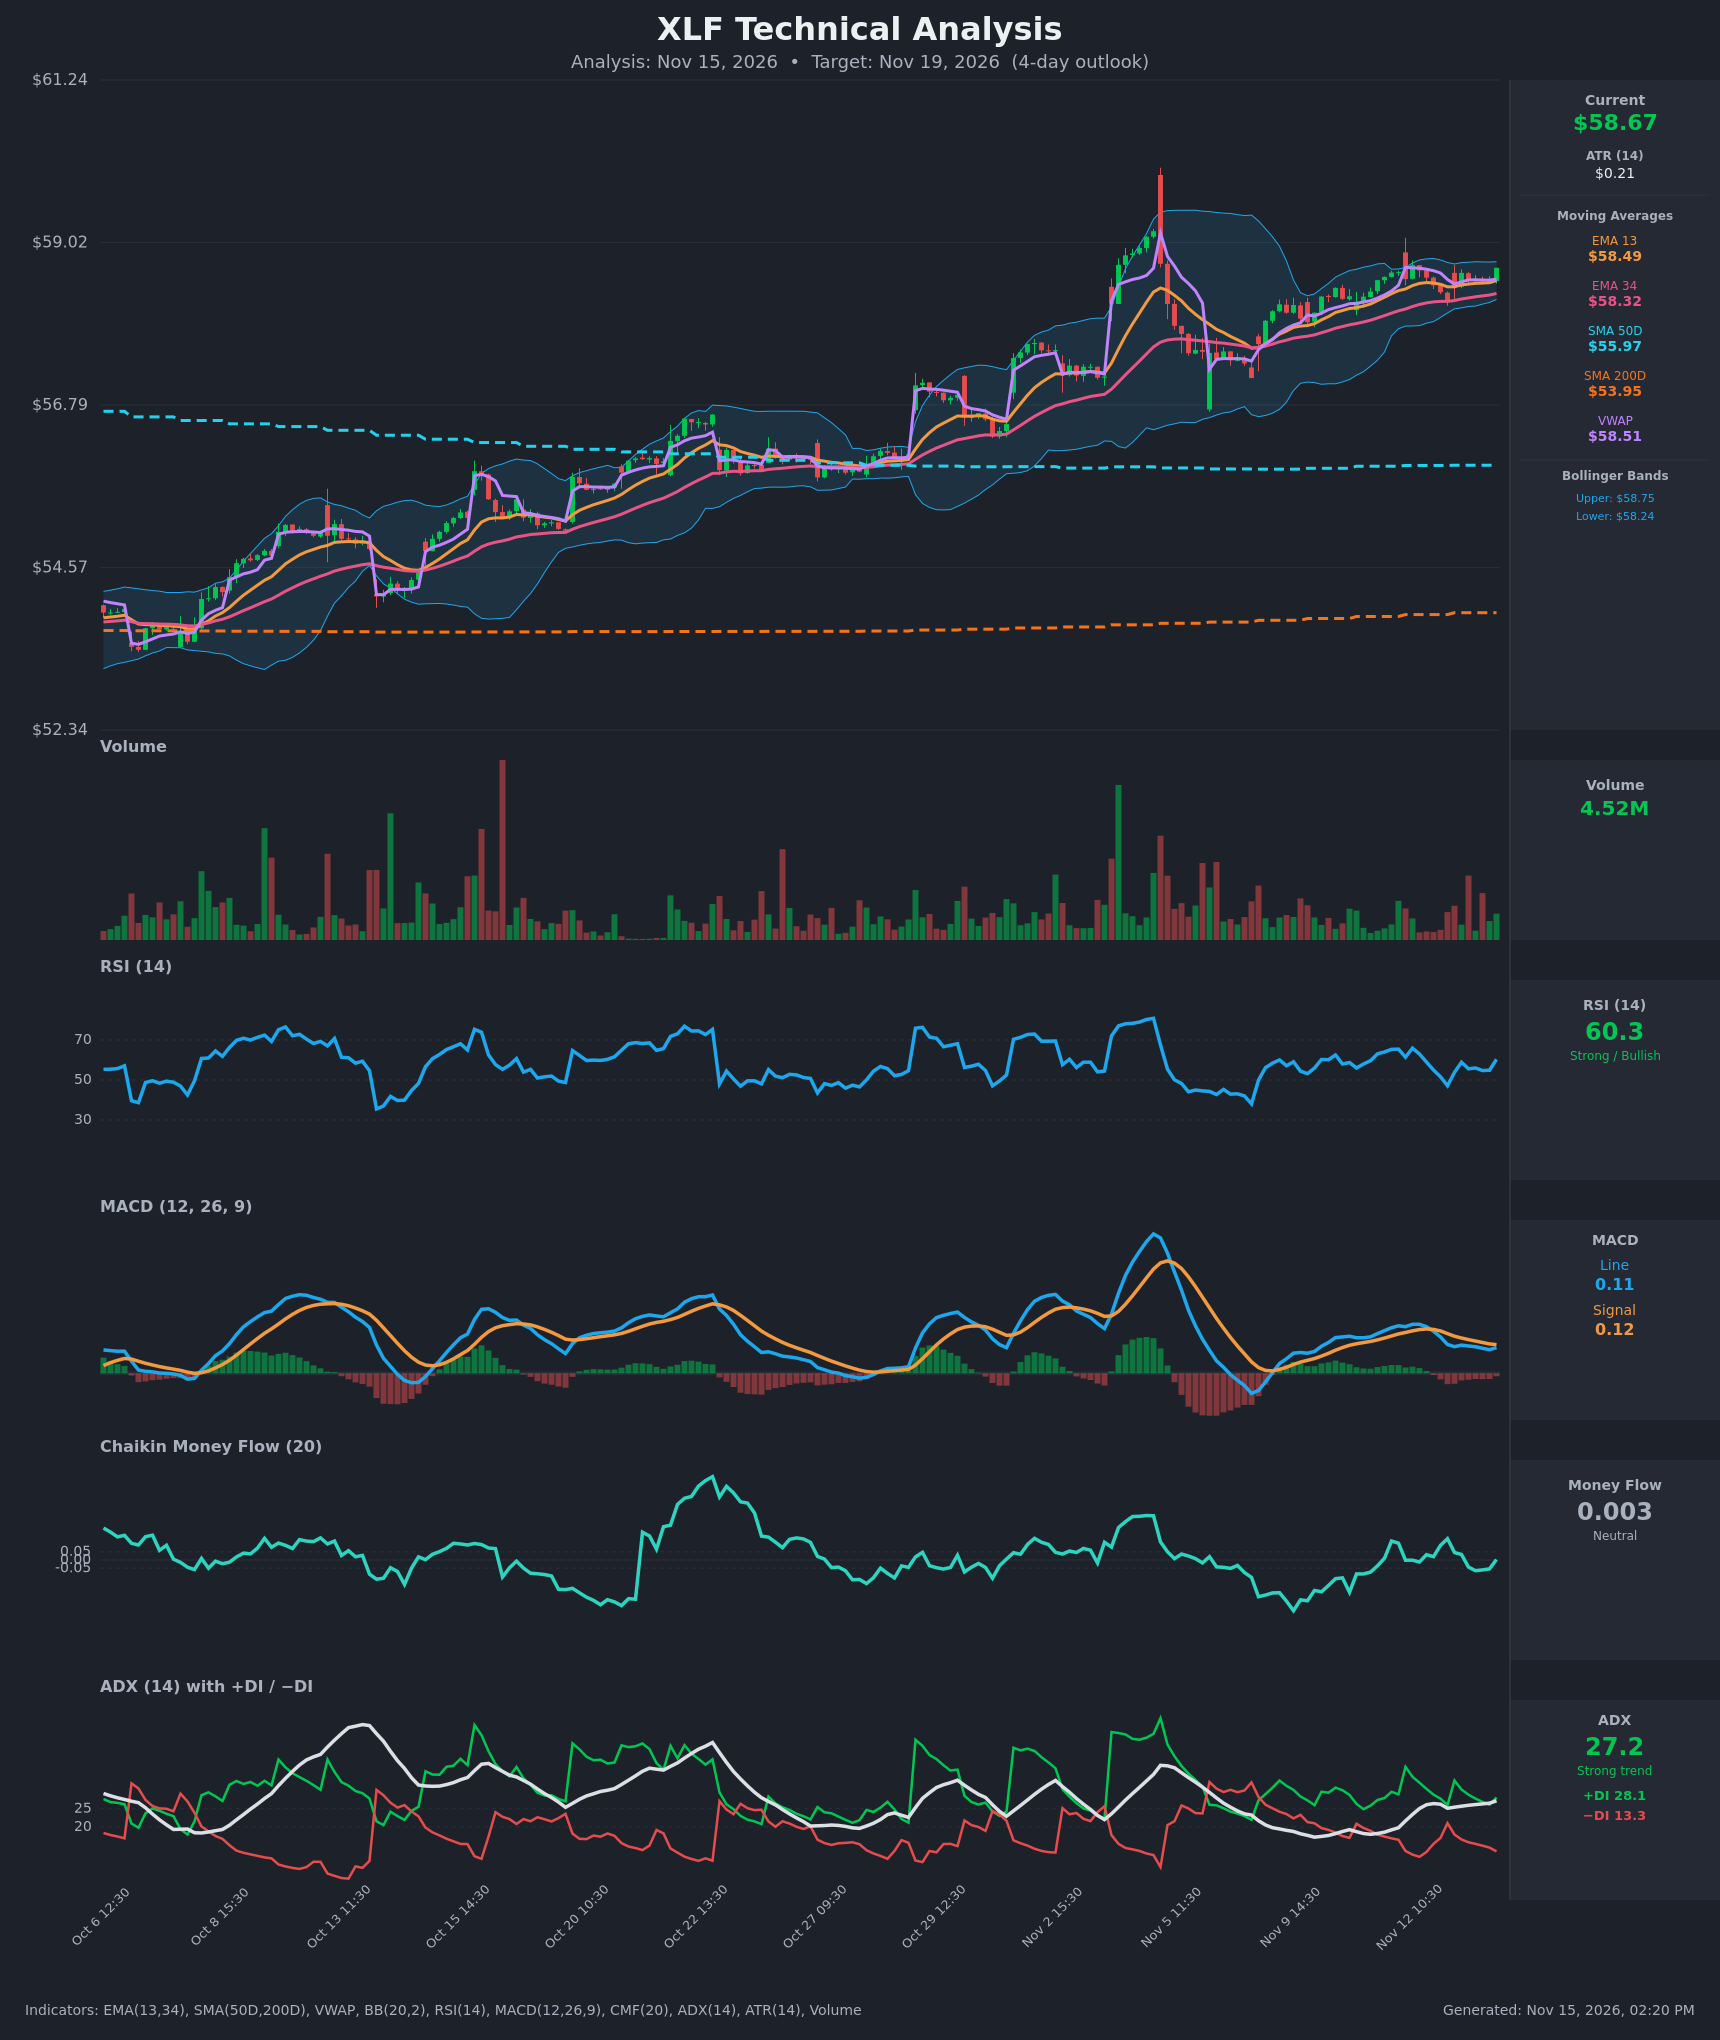
Analysis
TECHNICAL INDICATORS
- RSI (14): 60.31, rebounding from 47.1 on Nov 12 15:30. It is below the 65.9 peak from earlier that session, so momentum is positive but not stretched, with room before 70. [Bullish]
- 20 EMA: The supplied values are EMA 13 at $58.49 and EMA 34 at $58.32. Price at $58.67 is above both, and EMA13 is above EMA34 with a widening gap, so the short-term trend is intact. The EMAs and VWAP ($58.51) around $58.3-$58.5 form a support band. [Bullish]
- MACD: Line 0.108 against signal 0.120, so the histogram is slightly negative (about -0.012). The line has been below the signal since Nov 12 13:30. It is flattening and ticked up on the last bar, but the crossover has not turned bullish yet. [Neutral]
- Bollinger Bands (20): Upper $58.75, lower $58.24, with price at $58.67 in the upper quarter of the band. The bands are very narrow, a volatility squeeze after the Nov 5 spike and pullback. A squeeze with price in the upper half favors an upside expansion, but a close above $58.75 is needed to confirm. [Bullish]
- CMF (20): 0.003, inside the ±0.05 neutral zone. It was slightly negative midday on Nov 13 and has only just turned positive. There is no clear accumulation to back the advance. [Neutral]
- ADX (14): 27.2 and rising, with +DI 28.1 above −DI 13.3. That is a strong trend with bulls firmly in control. +DI has been above −DI throughout the recent bars. [Strong Trend + Bullish]
- Volume: 4.52M on the latest bar, in line with or slightly above recent average. Volume has been subdued during the tight consolidation, which is typical of a coil. The latest green bar on slightly better volume is a modest positive. [Neutral to mildly Bullish]
DIVERGENCES & TRENDS
- Mild bearish divergence (short term): Price is holding near the same highs ($58.70 on Nov 12 versus $58.67 now), but MACD has dropped from 0.206 to 0.108 and RSI peaked at 65.9 and now sits at 60.3. Momentum is cooling, which favors consolidation before any new push.
- Moving average structure: The stack is fully bullish, with price > EMA13 > EMA34 > SMA50 ($55.97) > SMA200 ($53.95). No recent crossovers, and the SMA50 stays well above the SMA200 (golden cross long established). Price is about 4.8% above the SMA50, so the larger trend is strong.
- Trend strength: ADX is rising through 25 (19.8 → 27.2) while +DI far exceeds −DI, confirming a trend-driven market rather than a range. The MACD histogram is sliding slightly negative and has not crossed, so a bullish MACD re-cross would be a useful trigger.
- Price vs VWAP: Price is above VWAP ($58.51), showing intraday buyers are in control.
CHART PATTERNS
- Bullish Pennant / Flag (continuation): After the sharp advance and the Nov 5 spike, price has consolidated in a tight, narrowing range of about $58.20-$58.75 with higher lows. This resembles the Bullish Pennant, with a Bollinger squeeze as confirmation. A break above $58.75 would target roughly $59.15-$59.50, the prior swing high zone and a measured move from the pennant.
- Failure case: The pattern fails on a close below $58.24 (the lower band and EMA34 area), which would point to a retest of the $57.9-$58.0 area.
- No reversal pattern (double top or head and shoulders) is evident. The mild momentum cooling is not enough to call a top.
POTENTIAL SCENARIOS
- Scenario 1: Bullish Pennant Breakout — Price breaks the Bollinger upper band and consolidation top, with the trend (ADX 27, +DI dominant) pushing it higher. Trigger: a close above $58.75 with a MACD bullish re-cross. Target: $59.15-$59.50. Invalidation: a close back below $58.30. (50% probability)
- Scenario 2: Neutral Continued Coil — Price keeps drifting in the $58.25-$58.80 range as momentum resets and the MACD flattens. Trigger: failure to close above $58.75 and RSI sliding back toward 50. Target: $58.40-$58.70. Invalidation: a decisive close outside the $58.20-$58.80 range. (30% probability)
- Scenario 3: Bearish Pullback — A loss of the EMA/VWAP support band, extending the MACD and RSI cooling. Trigger: a close below $58.24 on rising volume. Target: $57.80-$58.00. Invalidation: a reclaim of $58.50. (20% probability)
PRICE TARGETS
Target and range for a 4-day horizon:
- Target Price: $59.00 (the scenario-weighted central expectation, a modest upward drift in a strong uptrend)
- Expected Range: $57.65 to $59.70 (width $2.05, about 3.5% of the $58.67 current price, consistent with the 3-5% guidance for a 4-day window)
- Key Levels: Support at $58.32 (EMA 34, with the lower band at $58.24 just below), Resistance at $59.15 (prior swing high zone, above the $58.75 upper Bollinger Band)
OVERALL BIAS
OVERALL BIAS: BULLISH - Price sits above a fully bullish moving-average stack with ADX at 27.2 and +DI far above −DI. A Bollinger squeeze and pennant-like consolidation near the upper band favor an upside break. The slightly negative MACD histogram and neutral CMF argue for a modest rather than aggressive target.
This is educational analysis and not financial advice.