ORCL 6-day bullish forecast — Nov 15, 2026
- Bias: Bullish
- Timeframe: 6 days (made Nov 15, 2026, target date Nov 20, 2026)
- Price at analysis: $125.39
- Price target: $127.20
- Expected range: $122.60 – $130.00
- Result: Pending — graded after the close on Nov 20, 2026
Get a free AI analysis of ORCL today
Analysis
TECHNICAL INDICATORS
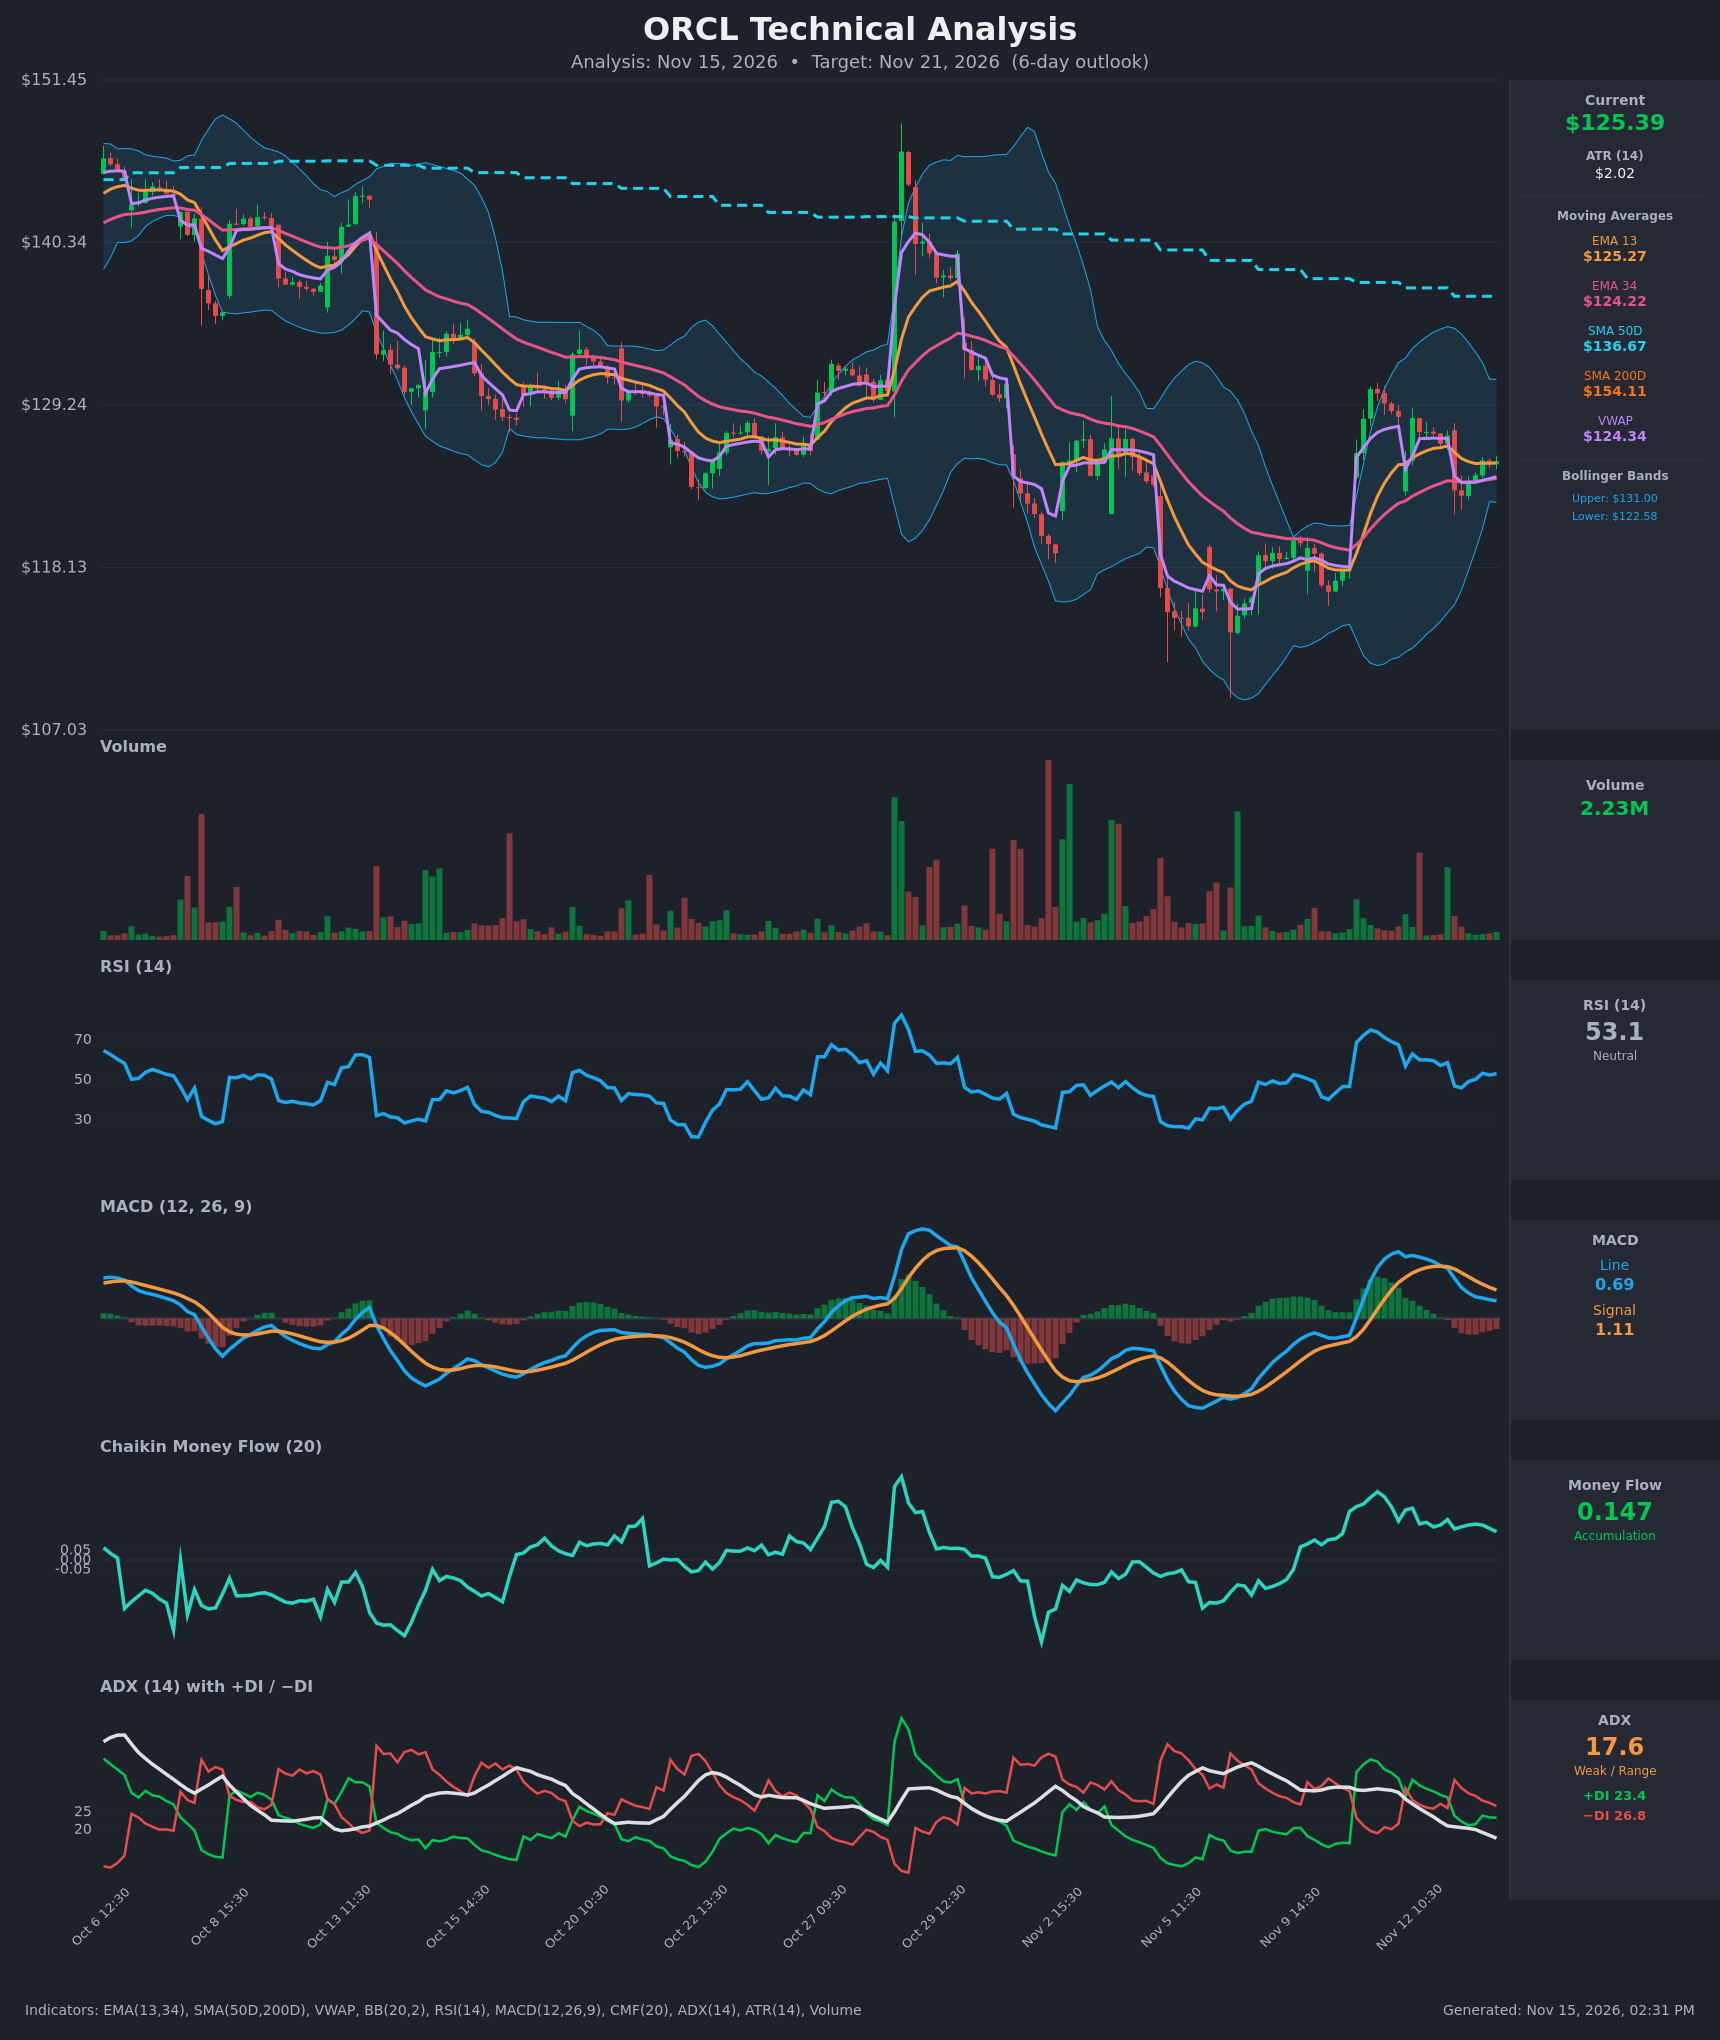
- RSI (14): 53.14, neutral and flat. It dropped from 67.6 on Nov 11 to a low of 46.0, then rebuilt to the low 50s, so momentum has reset without a clear direction. [Neutral]
- 20 EMA (EMA 13 / EMA 34 used): EMA 13 is $125.27 and EMA 34 is $124.22. Price at $125.395 is just above both, and EMA 13 is above EMA 34, so short-term support sits at $124.2–125.3. EMA 13 is flattening and the gap to EMA 34 is narrowing, so the support is thin. [Bullish]
- MACD: Line 0.689 is below signal 1.113, a bearish crossover from Nov 12. The histogram is -0.42, the least negative since Nov 12 12:30 (-0.63), so downside momentum is fading, but the line is still falling and there is no bullish cross yet. [Bearish]
- Bollinger Bands (20): Upper $131.00, lower $122.58, midline about $126.79. Price is slightly below the midline, in the lower-middle of the band. The bands are narrowing from the earlier expansion, which points to consolidation. [Neutral]
- CMF (20): 0.147, well above +0.05 and positive throughout the recent rebound. This is sustained accumulation, although it has eased from 0.268. [Accumulation]
- ADX (14): 17.6 and falling, so the trend is weak and range-bound. −DI (26.8) is above +DI (23.4), a slight bearish tilt, but the gap is small and the DI lines are converging. [Weak Trend, slight bearish tilt]
- Volume: 2.23M, light compared with the spikes on the Nov 11–12 gap-up. The pullback is on quiet volume, which looks like a digestion pause rather than heavy distribution. [Neutral to mildly Bullish]
- Moving averages and VWAP: Price is above VWAP ($124.34) but well below SMA50 ($136.67) and SMA200 ($154.11). SMA50 is below SMA200, so the long-term trend is down and both are overhead resistance. [Bearish long-term, Bullish short-term]
DIVERGENCES & TRENDS
- There is no clear price/RSI divergence. RSI lows on Nov 13 (46) came with price lows (~$123.04) at similar levels.
- The MACD histogram is improving (less negative) while price holds above the EMAs. This is an early sign of bearish momentum fading, not a confirmed reversal.
- CMF has stayed in accumulation (0.15–0.27) through the pullback from $128.4 to $123, which is a mild bullish divergence against the price dip.
- The Nov 12 MACD bearish crossover and the −DI over +DI crossover on Nov 12–13 are the main bearish signals.
- The ADX fell from 30.6 to 17.6, so the Nov 11 spike has lost trend strength and the market is consolidating.
- The longer-term picture remains a downtrend of lower highs, with price still far below the declining SMA50 and SMA200.
CHART PATTERNS
- Bullish Flag Pattern (continuation): After the sharp rally from about $115 to $131, price has drifted into a slightly descending channel at $123–128.5 on lower volume. A break above about $128.5 would project a measured move toward $131–133, which is also the upper Bollinger Band area.
- Range/rectangle consolidation: The weak ADX and narrowing bands support a $122.6–128.5 box.
- Bearish risk: A failed flag with a break below $122.6 would revisit the $118–120 area. Overhead SMA50 resistance at $136.67 caps larger upside.
POTENTIAL SCENARIOS
- Scenario 1: Bullish Flag Resolution Higher — Accumulation (CMF 0.147) and the above-EMA/VWAP close support a bounce toward the upper half of the range. Trigger: close above $126.8 (BB midline) and then $128.5. Target: $127.2–130.0. Invalidation: close below $123.0. (45% probability)
- Scenario 2: Bearish Breakdown of the Range — The MACD below signal, −DI dominance and the long-term downtrend pull price through the lower band. Trigger: close below $122.6 on rising volume. Target: $119.5–121.0. Invalidation: reclaim of $125.3 and EMA 13. (33% probability)
- Scenario 3: Neutral Range Chop — A weak ADX keeps price between $123 and $128. Trigger: failure of both the $128.5 and $122.6 breaks. Target: $124.5–126.5. Invalidation: any close outside $122.6–128.5. (22% probability)
PRICE TARGETS
- Target Price: $127.20 (6-day, about +1.4%)
- Expected Range: $122.60 to $130.00. Width is $7.40, about 5.9% of the current price, which fits the 4–8% guidance for a 6-day horizon.
- Key Levels: Support at $122.58, Resistance at $128.50
OVERALL BIAS
OVERALL BIAS: BULLISH - Sustained CMF accumulation, price above EMA 13/34 and VWAP, a flag-style consolidation on light volume and an improving MACD histogram slightly outweigh the MACD bearish cross and weak ADX. Conviction is modest because the long-term trend is still down.
This is educational analysis and not financial advice.