ORCL 4-day bearish forecast — Nov 15, 2026
- Bias: Bearish
- Timeframe: 4 days (made Nov 15, 2026, target date Nov 18, 2026)
- Price at analysis: $125.39
- Price target: $123.90
- Expected range: $121.50 – $127.90
- Result: Pending — graded after the close on Nov 18, 2026
Get a free AI analysis of ORCL today
Analysis
TECHNICAL INDICATORS
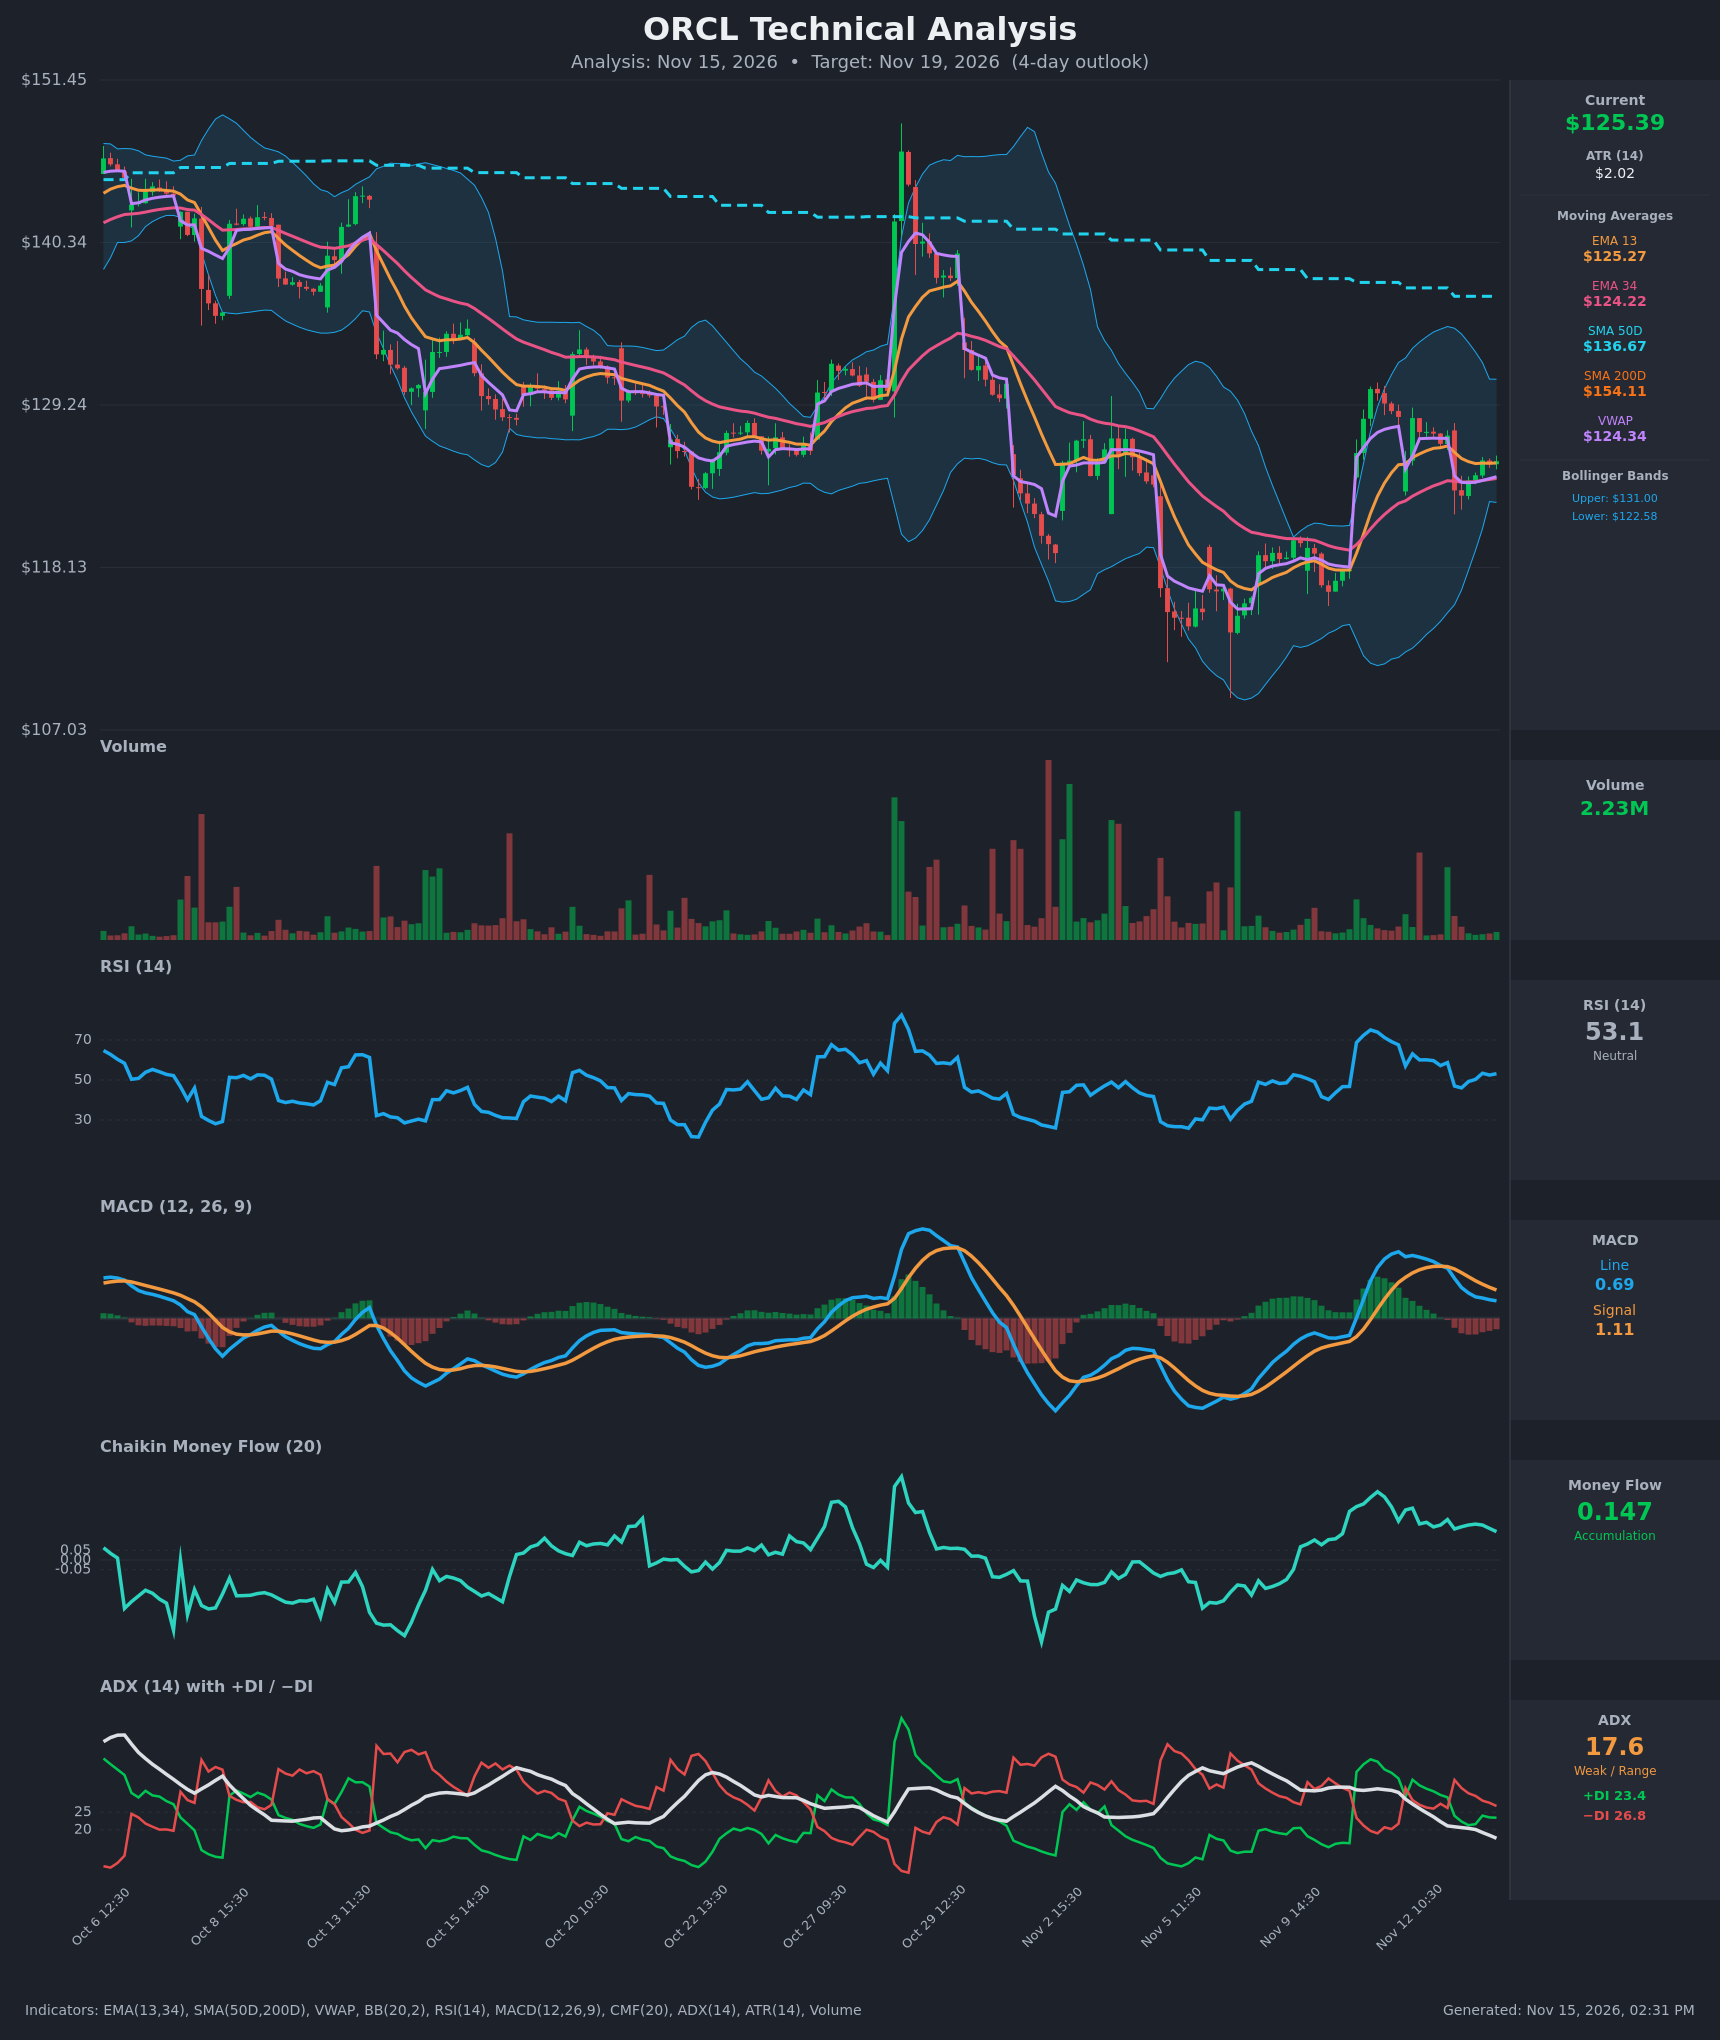
- RSI (14): 53.14, neutral and mid-range. It has faded from 67.6 on Nov 11 and bottomed near 46 on Nov 13 before a modest recovery. Momentum is flat with no overbought or oversold signal. [Neutral]
- 20 EMA: The chart shows EMA 13 at $125.27 and EMA 34 at $124.22. Price at $125.40 is just above both, so they act as thin support. EMA13 is still above EMA34, but the gap has shrunk from about $2.6 to about $1.05, and EMA13 is flattening. [Neutral]
- MACD: Line 0.689 is below signal 1.113, so the histogram is negative at about -0.42. The bearish crossover happened on Nov 12 at 15:30, and the histogram is still negative, though the pace of decline is slowing. The line remains positive, so momentum is fading rather than strongly bearish. [Bearish]
- Bollinger Bands (20): Upper $131.00, lower $122.58, with a midline near $126.8. Price sits slightly below the midline, in the middle of the band, with no squeeze or breakout. The band is still wide from the earlier volatility. [Neutral]
- CMF (20): 0.147, above +0.05 and sustained positive since early November. This shows accumulation and buying pressure, although it has eased from 0.268. [Accumulation]
- ADX (14): 17.6 and falling, from 30.6 on Nov 11, which means a weak, range-bound market. −DI (26.8) is above +DI (23.4), a mild bearish tilt after the DI cross on Nov 12–13. [Weak Trend + mild bearish tilt]
- Volume: 2.23M on the latest bar, light compared with the spikes on the Nov 11 rally and earlier selloffs. The recent consolidation is on drying volume, so there is little conviction in either direction. [Neutral / low conviction]
Other levels:
- VWAP: $124.34, just under price, which is a mild positive.
- SMA50D: $136.67, well above price.
- SMA200D: $154.11, far above price.
- Moving-average cross: the 50D is below the 200D, a death-cross configuration, and price is below both. The long-term trend is down.
DIVERGENCES & TRENDS
- MACD/price: There is no clean divergence. Price has held in a $123–$128 band while MACD has rolled over from 2.6 to 0.69. This is a loss of upside momentum after the Nov 11 spike, not a divergence.
- CMF vs. MACD/DI: CMF is still positive (0.147) while MACD and −DI lean bearish. This is a mild conflict, and accumulation may be the only thing stopping a bigger pullback.
- ADX trend: ADX has dropped from over 30 to 17.6, so the Nov 11 impulse is exhausted and the market has moved into a range.
- Crossovers: There was a bearish MACD cross and a −DI/+DI flip on Nov 12–13. EMA13 is still above EMA34 but converging. A cross below would confirm short-term weakness.
- Higher timeframe: Price has made lower highs since early October (the peak near $146 and the later rally near $140) and remains below a declining SMA50, which is a long-term bearish structure. The bounce from the ~$115 low is a counter-trend recovery.
CHART PATTERNS
- Bullish Flag / Pennant (possible): The sharp Nov 11 rally from the ~$115–118 area into the high $120s was followed by a tight, slightly downward-drifting consolidation. A break above ~$128.4 could target the $131 upper band, and then the $136.7 SMA50D (the flag-pole measure).
- Bearish context: The bounce has stalled well below the falling SMA50D, and the sequence of lower highs since October looks like a bear-market rally within a downtrend. A loss of the EMA34/VWAP zone ($124.2–$124.3) would open a move to the $122.6 lower band.
- Verdict: There is no confirmed pattern. The structure is a range with a slight bearish lean, given MACD and the DI readings.
POTENTIAL SCENARIOS
- Scenario 1: Bearish Drift Back to Band Support — Momentum keeps fading, with MACD below signal and −DI on top, and price loses the EMA34/VWAP cluster. Trigger: a hourly close below $124.20. Target: $122.60–$123.90 (lower Bollinger Band area). Invalidation: a close above $127.50. (45% probability)
- Scenario 2: Bullish Flag Breakout — CMF accumulation holds, price defends EMA13/EMA34, and it breaks the recent highs. Trigger: a close above $128.40 on rising volume. Target: $130.00–$131.00 (upper band). Invalidation: a close below $123.40. (35% probability)
- Scenario 3: Neutral Range Chop — With ADX below 20, price oscillates around the EMAs and VWAP. Trigger: failure to break either $124.20 or $128.40. Target: $124.50–$126.50. Invalidation: a break outside $123.40–$128.40. (20% probability)
PRICE TARGETS
For the 4-day horizon (target date Nov 19, 2026):
- Target Price: $123.90
- Expected Range: $121.50 to $127.90 (width $6.40, about 5.1% of the current price, which fits the 4-day timeframe)
- Key Levels: Support at $124.22 (EMA34, with VWAP at $124.34; below that $122.58 lower band), Resistance at $128.40 (recent high; above that $131.00 upper band)
OVERALL BIAS
OVERALL BIAS: BEARISH - MACD is below its signal line with a negative histogram, −DI is above +DI, and price sits below the falling SMA50D and SMA200D. The bounce is stalling on thin volume, so a drift toward the $124 support and the $122.6 lower band is the single most likely outcome. Conviction is modest because CMF shows accumulation and ADX is weak.
This is educational analysis and not financial advice.