MSFT 6-day bullish forecast — Nov 15, 2026
- Bias: Bullish
- Timeframe: 6 days (made Nov 15, 2026, target date Nov 20, 2026)
- Price at analysis: $524.31
- Price target: $527.50
- Expected range: $514.00 – $535.00
- Result: Pending — graded after the close on Nov 20, 2026
Get a free AI analysis of MSFT today
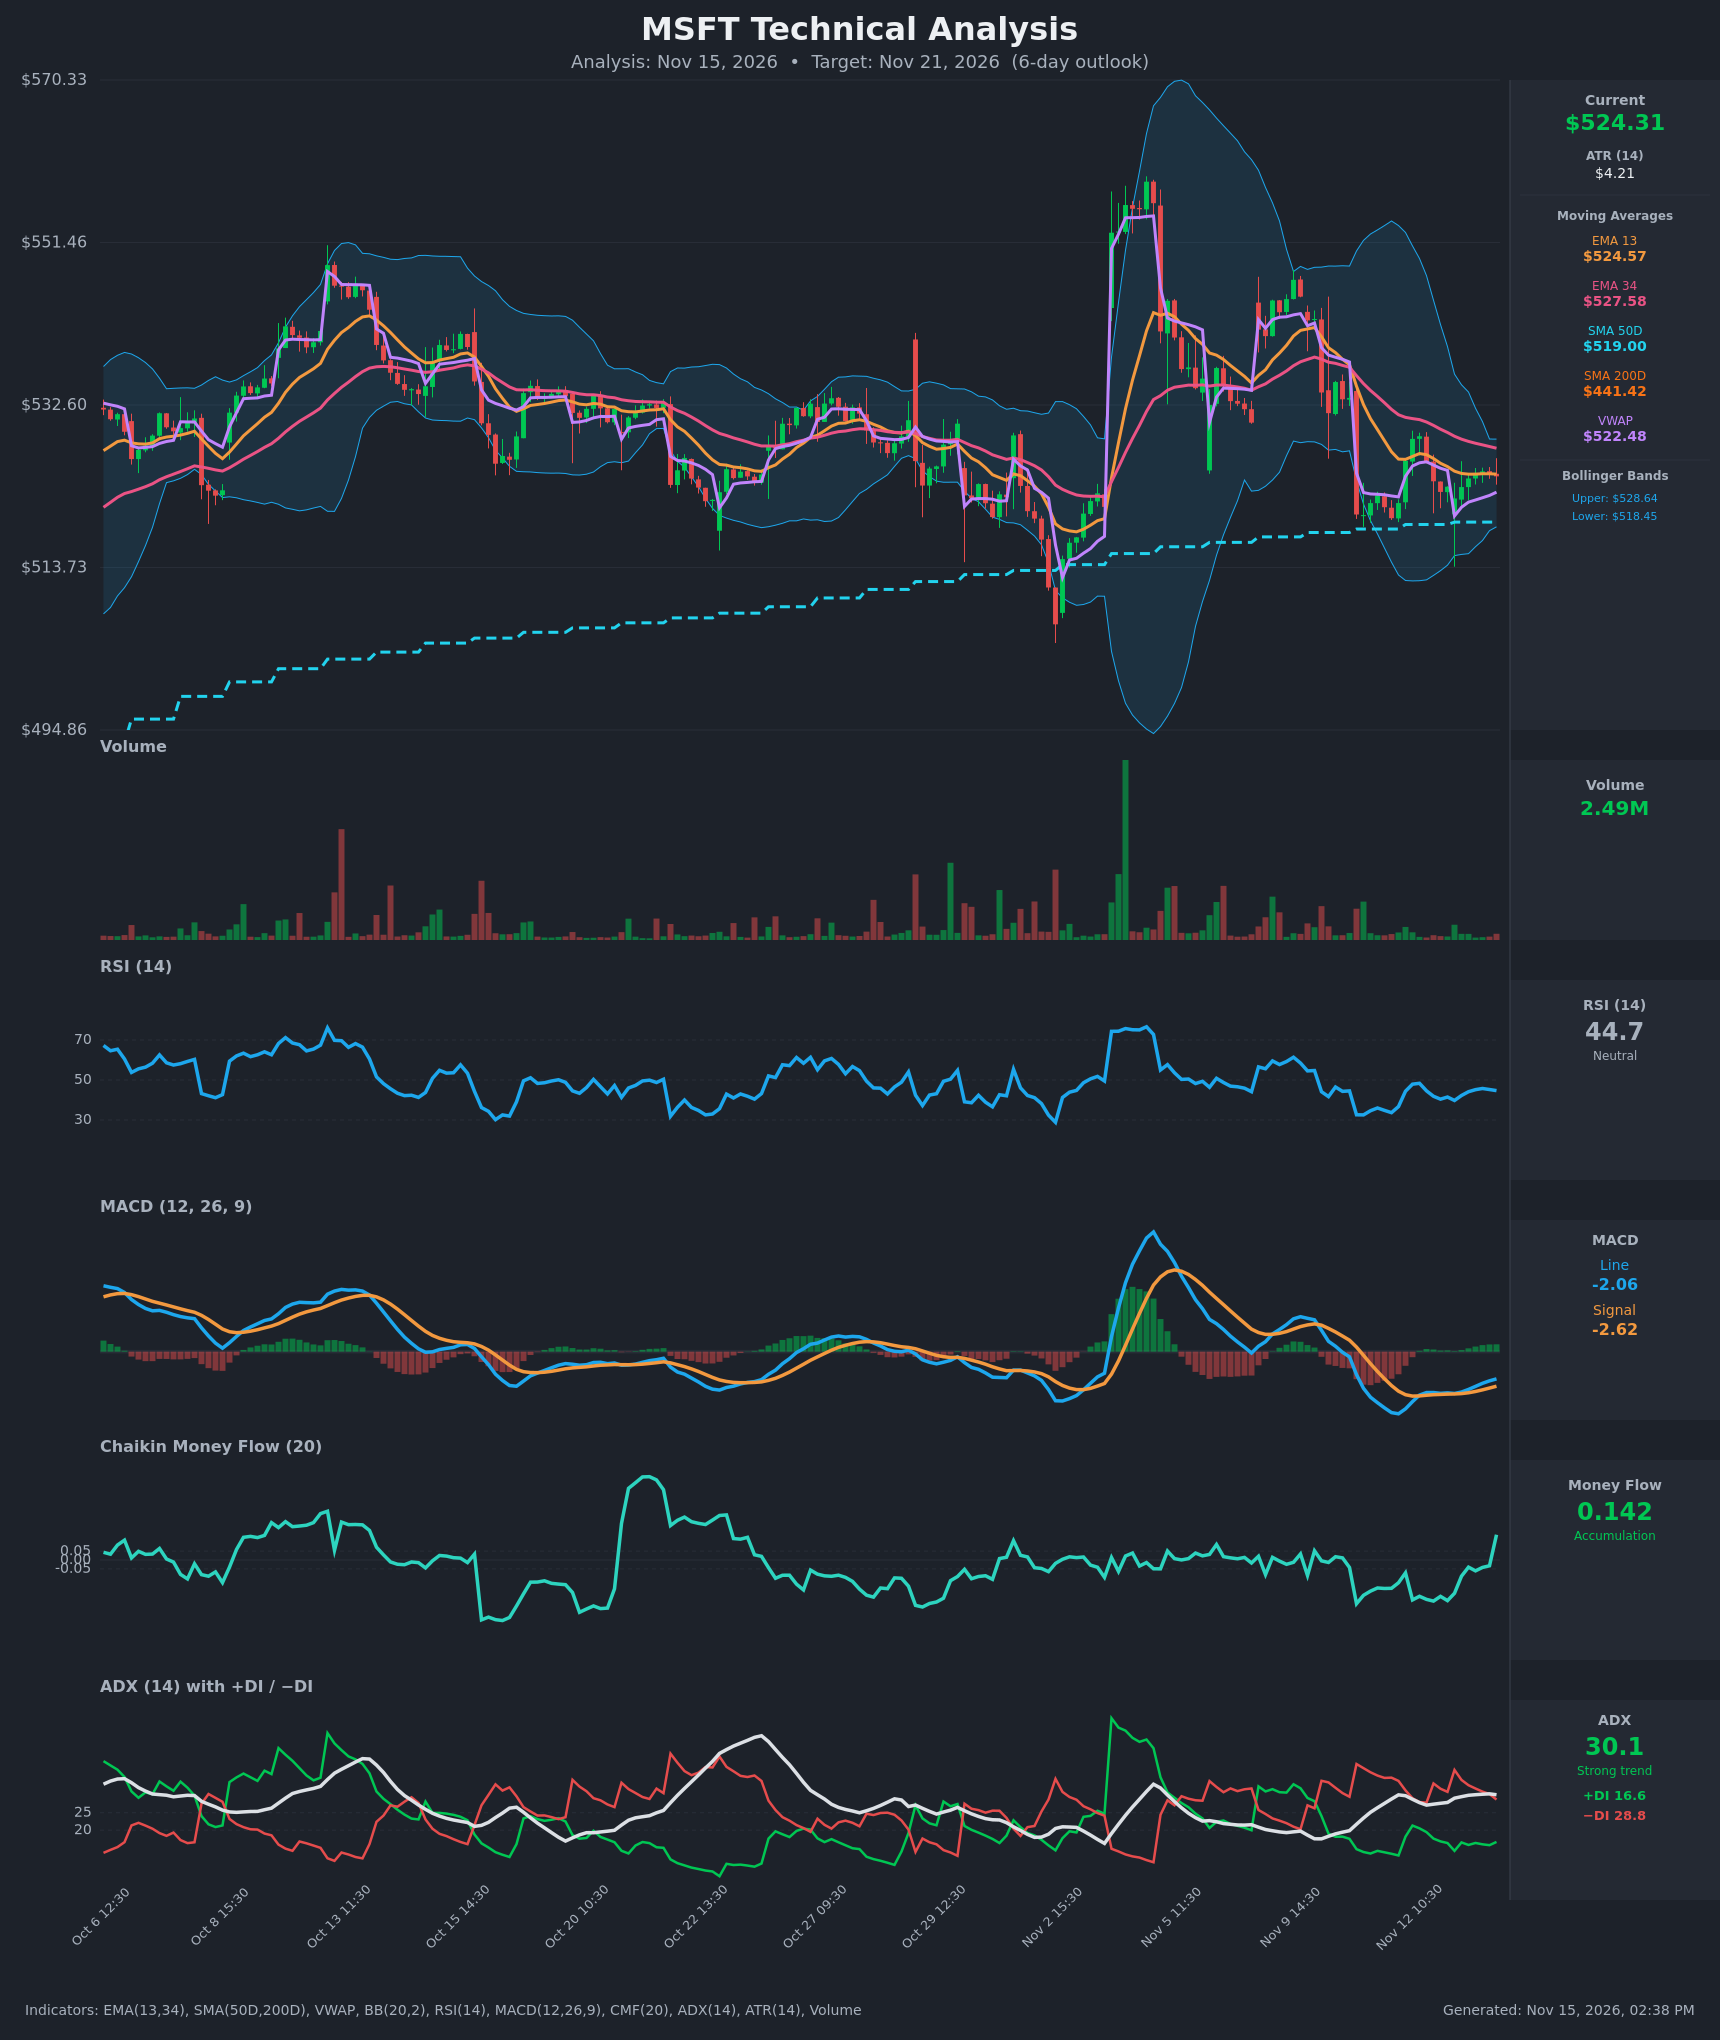
Analysis
TECHNICAL INDICATORS
- RSI (14): 44.69, below the 50 midline but well off the 36.7 low on Nov 11. It has been recovering for several sessions without reaching bullish territory. [Neutral]
- 20 EMA: The chart shows EMA 13 at $524.57 and EMA 34 at $527.58. Price at $524.31 sits right on EMA 13 and about $3.3 below EMA 34. EMA 13 is below EMA 34, so the short-term trend is down and EMA 34 is overhead resistance. [Bearish]
- MACD: Line -2.06 is above Signal -2.62, a bullish crossover that occurred around Nov 12-13. The histogram is positive and rising, but both lines are still below zero. This is a recovery from oversold, not yet a confirmed trend change. [Bullish]
- Bollinger Bands (20): Upper $528.64, lower $518.45, middle about $523.5. Price sits just above the midline, in the upper half of a narrow band. The squeeze signals low volatility, so an expansion move is likely. [Neutral]
- CMF (20): 0.142, a jump from slightly negative readings (about -0.03 to -0.06) over the last few bars. It is above the +0.05 threshold, so buying pressure is emerging. The reading is fresh and needs follow-through. [Accumulation]
- ADX (14): 30.1 with −DI 28.8 above +DI 16.6, which is a strong trend dominated by sellers. The gap has narrowed from 34.1/12.8 and −DI is fading, so the downtrend is losing steam. ADX is flat at about 30. [Strong Trend – Bearish, weakening]
- Volume: 2.49M, low and below the recent spikes, so the bounce lacks conviction. The rally off Nov 11 has come on light volume. [Neutral / Weak Confirmation]
Other reference levels: VWAP is $522.48 (price slightly above, mild buying support), SMA50D is $519.00 (support just below), and SMA200D is $441.42 (a long-term uptrend). The 50D/200D golden cross is long established.
DIVERGENCES & TRENDS
- MACD/Price: The MACD histogram turned positive and rose from -4.7 to -2.06 while price made a higher low from $521.21 to $521.75. That is a mild bullish momentum improvement.
- CMF: It has turned sharply from negative to positive, a possible early accumulation signal. It diverges from the bearish DI structure.
- ADX/DI: −DI has dropped from 37 to 29 and +DI has risen from 13 to 17. Bears still control, but their grip is easing.
- Crossovers: The bullish MACD signal cross is recent. EMA 13 remains below EMA 34, and price keeps getting rejected near EMA 34 (around $528-529) on bounces.
- Trend: Price has been choppy and range-bound since the early-November spike and reversal, making lower highs ($528.97 vs. $533+ earlier), with Nov 12 hourly highs capped near $529.
CHART PATTERNS
- Base pattern: Price is consolidating between roughly $518 and $529 with narrowing Bollinger Bands. This resembles a small Symmetrical Triangle / Bearish Pennant (continuation), with lower highs against a floor near $518-519 (SMA50D plus the lower band).
- Larger structure: The Oct–Nov swing high near $551-552, the Nov 5 failure and the lower highs since resemble a Bearish Rising Wedge or Head and Shoulders structure, though neither is clean.
- Implication: A break below $518 could target roughly $510-513, the next support area on the chart. A break above $529 would negate the pennant and target the $535-540 area. With MACD turning up and CMF improving, the likelier resolution is a modest upward drift with resistance at EMA 34, but the larger trend (−DI dominant) caps it.
POTENTIAL SCENARIOS
- Scenario 1: Bullish Relief Grind Toward EMA 34 — MACD is crossing up, CMF has flipped to accumulation, and RSI is recovering from oversold. Price holds the SMA50D/VWAP area and drifts to the upper Bollinger Band. Trigger: hourly close above $526.50 and the EMA 34 at about $527.5. Target: $528-530. Invalidation: close below $518.50. (40% probability)
- Scenario 2: Neutral Range Chop — Price oscillates between $519 and $528 as the squeeze persists and volume stays light. Trigger: failure to break either band edge. Target: $522-526. Invalidation: a close outside $518 or $529. (30% probability)
- Scenario 3: Bearish Rejection and Breakdown — −DI remains dominant with ADX at 30, and price gets rejected at EMA 34 and the upper band, then loses SMA50D support. Trigger: close below $518.45 (lower band and SMA50D). Target: $511-514. Invalidation: close above $529.50. (30% probability)
PRICE TARGETS
The 6-day horizon calls for a range width of about 4-8% of price. ATR is $4.21, so a 6-day move of roughly 1.5-2 ATR is reasonable. The range of $509.50 to $535.50 is $26.00 wide, or about 5.0% of $524.31, which fits the guidance.
The bullish momentum signals (MACD cross, CMF) slightly outweigh the lingering bearish trend (−DI, EMA 34), so I lean modestly upward, though conviction is modest.
- Target Price: $527.50
- Expected Range: $514.00 to $535.00 (width $21.00, about 4.0% of price)
- Key Levels: Support at $519.00, Resistance at $528.64
OVERALL BIAS
OVERALL BIAS: BULLISH - A fresh bullish MACD crossover, CMF flipping to accumulation at 0.142, and RSI recovering from oversold point to a modest grind toward the EMA 34/upper band near $527-529. The still-dominant −DI and the overhead EMA 34 limit the upside.
This is educational analysis and not financial advice.