MSFT 4-day bullish forecast — Nov 15, 2026
- Bias: Bullish
- Timeframe: 4 days (made Nov 15, 2026, target date Nov 18, 2026)
- Price at analysis: $524.31
- Price target: $527.50
- Expected range: $513.00 – $534.50
- Result: Pending — graded after the close on Nov 18, 2026
Get a free AI analysis of MSFT today
Analysis
TECHNICAL INDICATORS
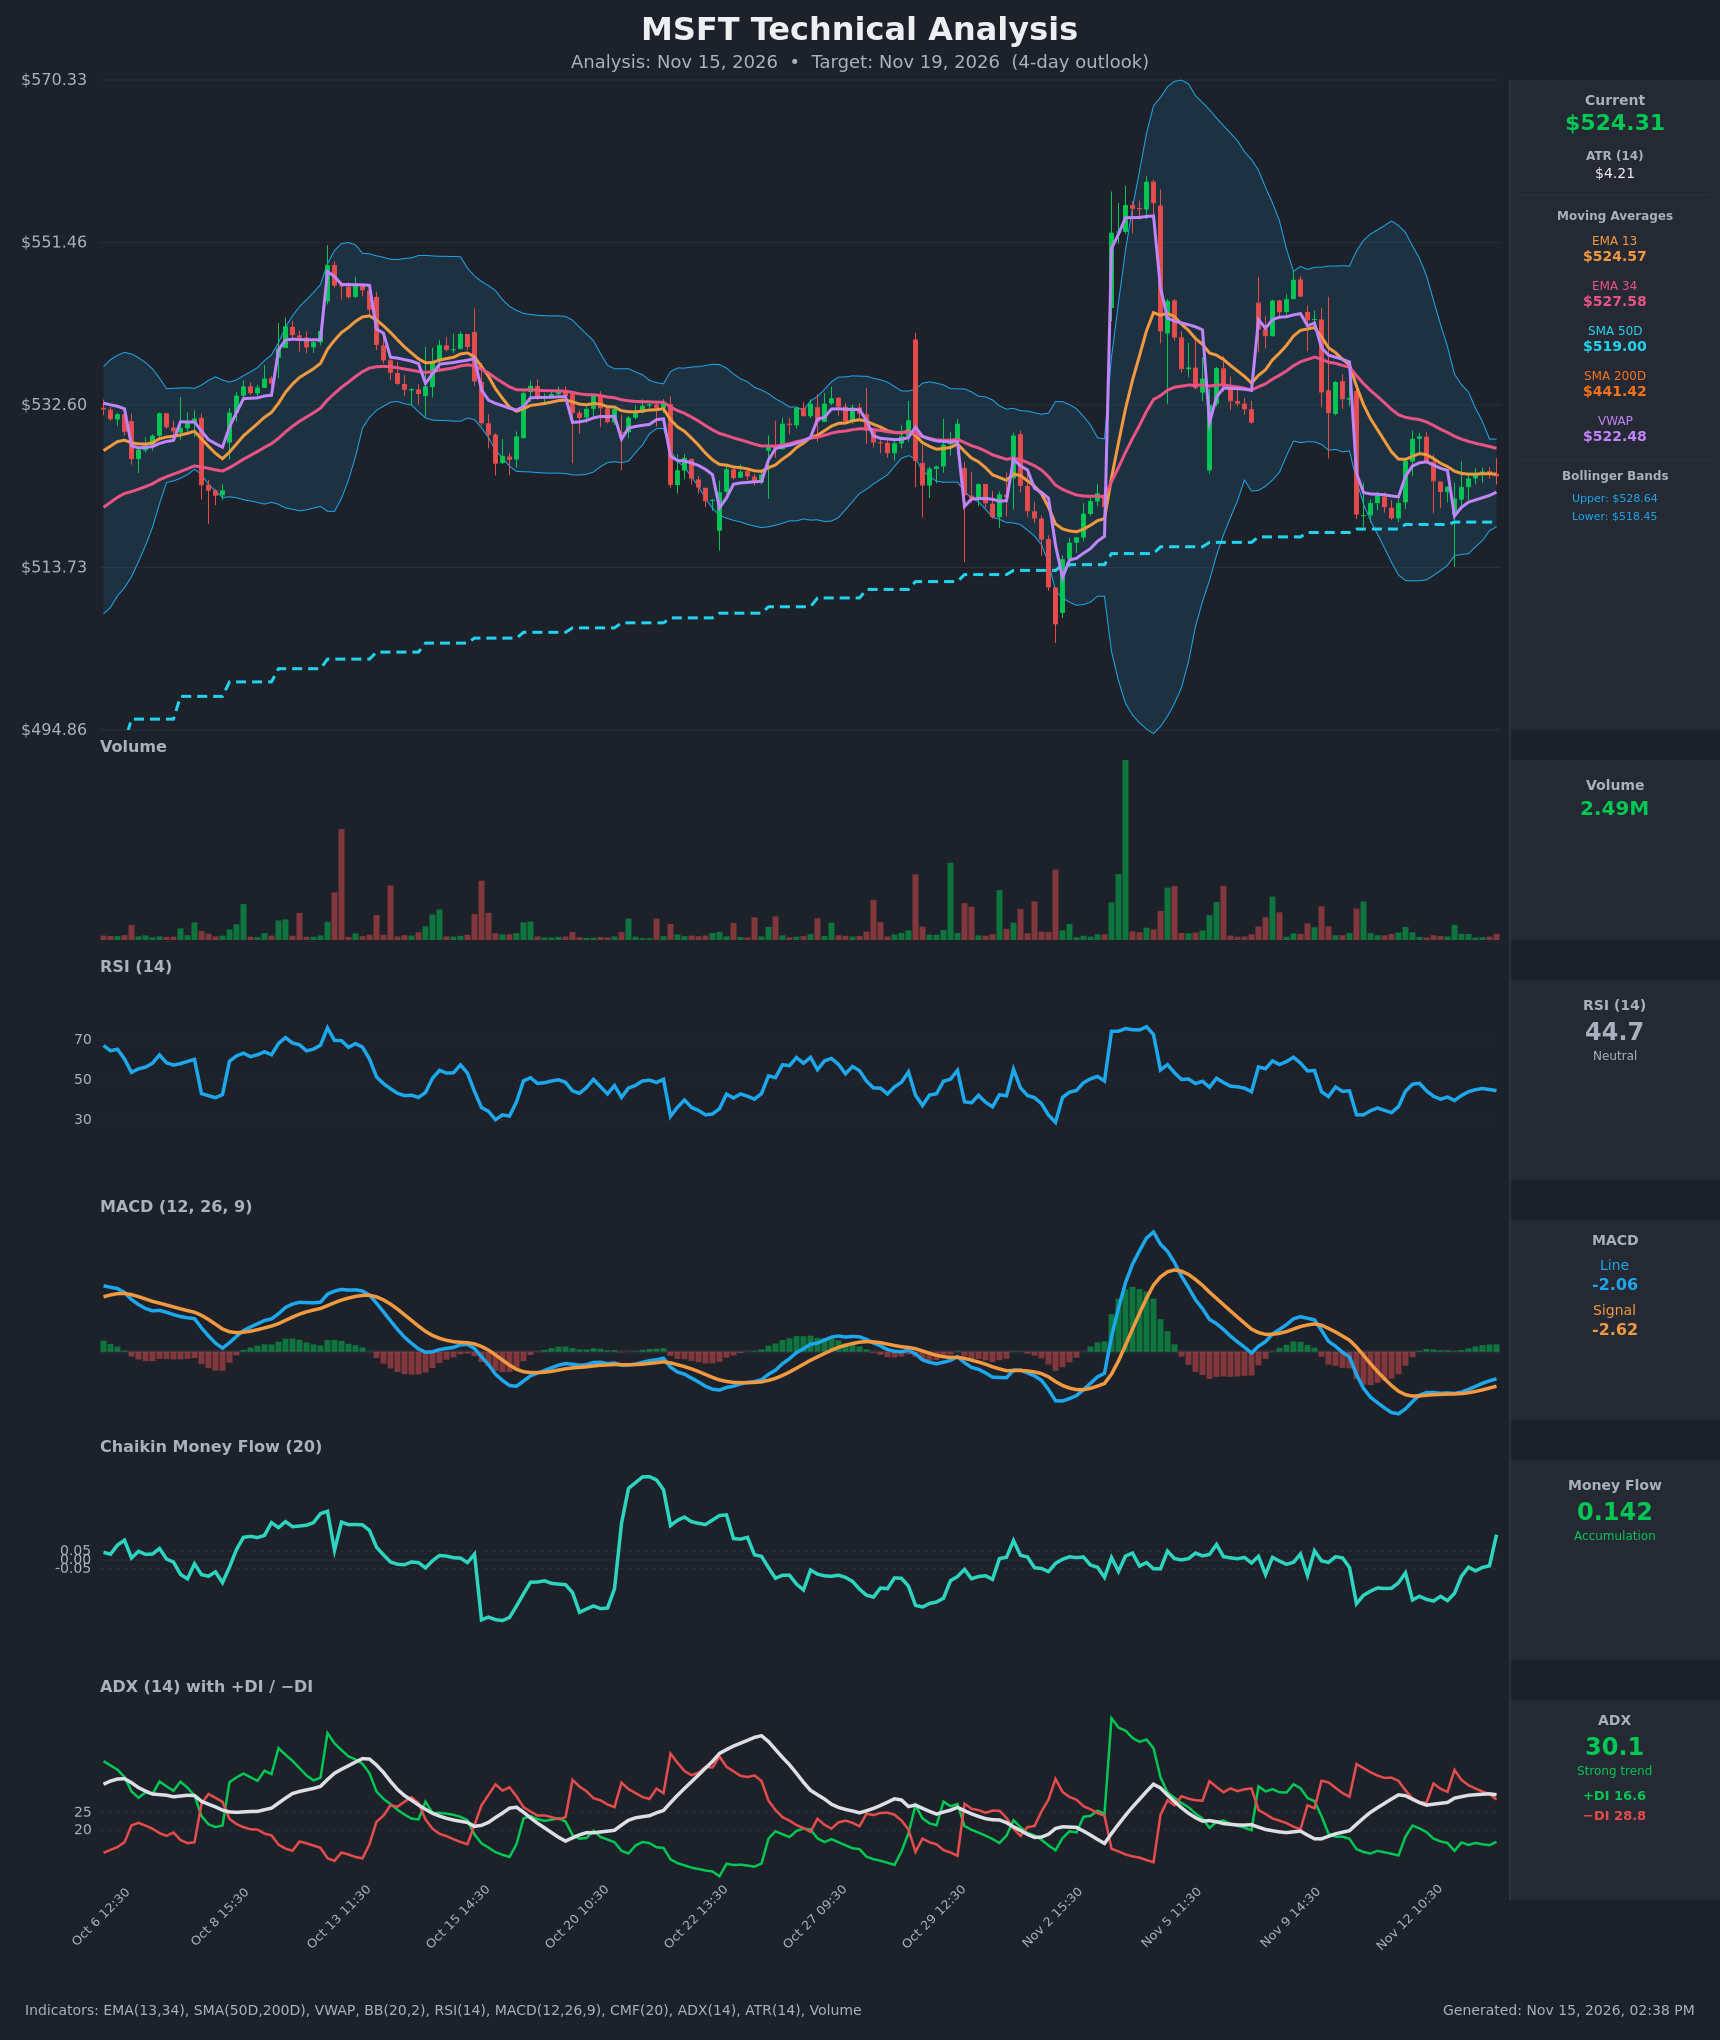
- RSI (14): 44.69, below the 50 midline but up from 36.7 on Nov 11 and 39.8 on Nov 13 open. Momentum is recovering from near-oversold, but it has not reclaimed 50. [Neutral]
- 20 EMA: The chart shows EMA 13 ($524.57) and EMA 34 ($527.58). Price ($524.31) sits just under EMA13 and about $3.30 below EMA34. EMA13 is below EMA34, a bearish alignment, but the gap has narrowed from about $5 to $3. EMA34 is the overhead resistance. [Bearish]
- MACD: The line is -2.061 and the signal is -2.617, so the histogram is positive (+0.56) and rising. MACD crossed above the signal around Nov 12 11:30 and has been widening since. Both lines are still below zero, so this is an early recovery rather than a confirmed trend change. [Bullish]
- Bollinger Bands (20): The bands run $518.45 to $528.64, with a midline near $523.55. Price is just above the midline and the bands are contracting sharply after the large Nov 6 expansion. A squeeze like this usually precedes a directional move. Price is not at either extreme. [Neutral]
- CMF (20): 0.142, a sharp jump from about -0.03 and the first clear accumulation reading (>+0.05) in several sessions. It suggests buyers are absorbing supply near $520-524. [Accumulation]
- ADX (14): 30.1 with −DI (28.8) above +DI (16.6). That is a strong trend, but the trend is bearish. The bearish side is fading, though: −DI has fallen from 37.3 to 28.8 and +DI has risen from 14.1 to 16.6. [Strong Trend – Bearish, weakening]
- Volume: 2.49M, light and below the spikes seen on the Nov 6 gap and earlier sell-offs. The recent bounce is happening on subdued volume, so there is little conviction in either direction. [Neutral / Low Participation]
DIVERGENCES & TRENDS
- Bullish momentum shift: MACD crossed above its signal while price made a roughly flat-to-higher low ($521.75 vs. $521.21). The histogram has turned positive.
- Fading bearish pressure: −DI is declining and +DI is rising. A DI crossover is not close, but the gap has narrowed from about 24 points to 12.
- CMF leading price: The jump to +0.142 while price is still below EMA34 is an early accumulation signal.
- Bearish overhang: The bounce has not yet reclaimed EMA13/EMA34, and ADX at 30 confirms the prevailing path has been down since the Nov 6 spike. Price is still making lower highs ($528.97, then $524.89).
- Long-term structure: Price is well above the SMA200D ($441.42) and above the SMA50D ($519.00), so the long-term uptrend is intact. Price is sitting on SMA50D support, and VWAP ($522.48) is just below price.
- Moving-average status: There is no recent golden or death cross. The EMA13/EMA34 bearish stack persists.
CHART PATTERNS
- Descending-triangle / symmetrical-triangle consolidation: Since the Nov 6 spike, price has made lower highs against support near $518–521, and the narrowing Bollinger Bands support this reading. Per the reference diagram, a symmetrical triangle can break either way. Here the higher low and the positive MACD/CMF tilt the odds slightly toward an upside break.
- Possible bullish falling wedge / small flag: The decline from the Nov 6 gap high has been in a downward-sloping channel. A close above EMA34 (~$527.6) would break the channel and open a move toward $533–535.
- Targets: A measured move off the ~$10 range implies roughly $529–$534 on an upside break and about $514–$516 on a downside break through the SMA50D/lower band.
POTENTIAL SCENARIOS
- Scenario 1: Bullish Squeeze Breakout — MACD and CMF momentum carries price through EMA34 as the Bollinger squeeze resolves upward. Trigger: a close above $527.60 on rising volume. Target: $531–$534 (upper band area and the mid-chart supply zone). Invalidation: a close below $519.00. (45% probability)
- Scenario 2: Neutral Range Chop — Low volume and a squeeze keep price between the SMA50D and the upper Bollinger Band. Trigger: failure to break either $528.64 or $518.45. Target: $520–$528 range. Invalidation: a decisive close outside either band. (30% probability)
- Scenario 3: Bearish Trend Resumption — ADX >25 with −DI dominant means sellers regain control after rejection at EMA34. Trigger: a rejection at $527.60 followed by a break below $519.00. Target: $513–$516. Invalidation: a close above $528.64. (25% probability)
PRICE TARGETS
Range width check: $534.50 − $513.00 = $21.50, or about 4.1% of $524.31. That fits a 4-day horizon: wider than a 2–3 day range and narrower than a 7–10 day range. It is also about 5 × ATR ($4.21), a reasonable 4-day spread.
- Target Price: $527.50 (for the 4-day timeframe, a test of EMA34)
- Expected Range: $513.00 to $534.50
- Key Levels: Support at $519.00 (SMA50D, just above the $518.45 lower band), Resistance at $528.64 (upper Bollinger Band, just above EMA34 at $527.58)
OVERALL BIAS
OVERALL BIAS: BULLISH - A fresh MACD bullish crossover, a CMF jump into accumulation, falling −DI and price holding the SMA50D support point to a modest upside move toward EMA34. Conviction is modest because ADX still shows a bearish trend and the bounce is on light volume.
This is educational analysis and not financial advice.