RKLB 4-day bearish forecast — Nov 15, 2026
- Bias: Bearish
- Timeframe: 4 days (made Nov 15, 2026, target date Nov 18, 2026)
- Price at analysis: $61.53
- Price target: $60.40
- Expected range: $58.30 – $62.55
- Result: Pending — graded after the close on Nov 18, 2026
Get a free AI analysis of RKLB today
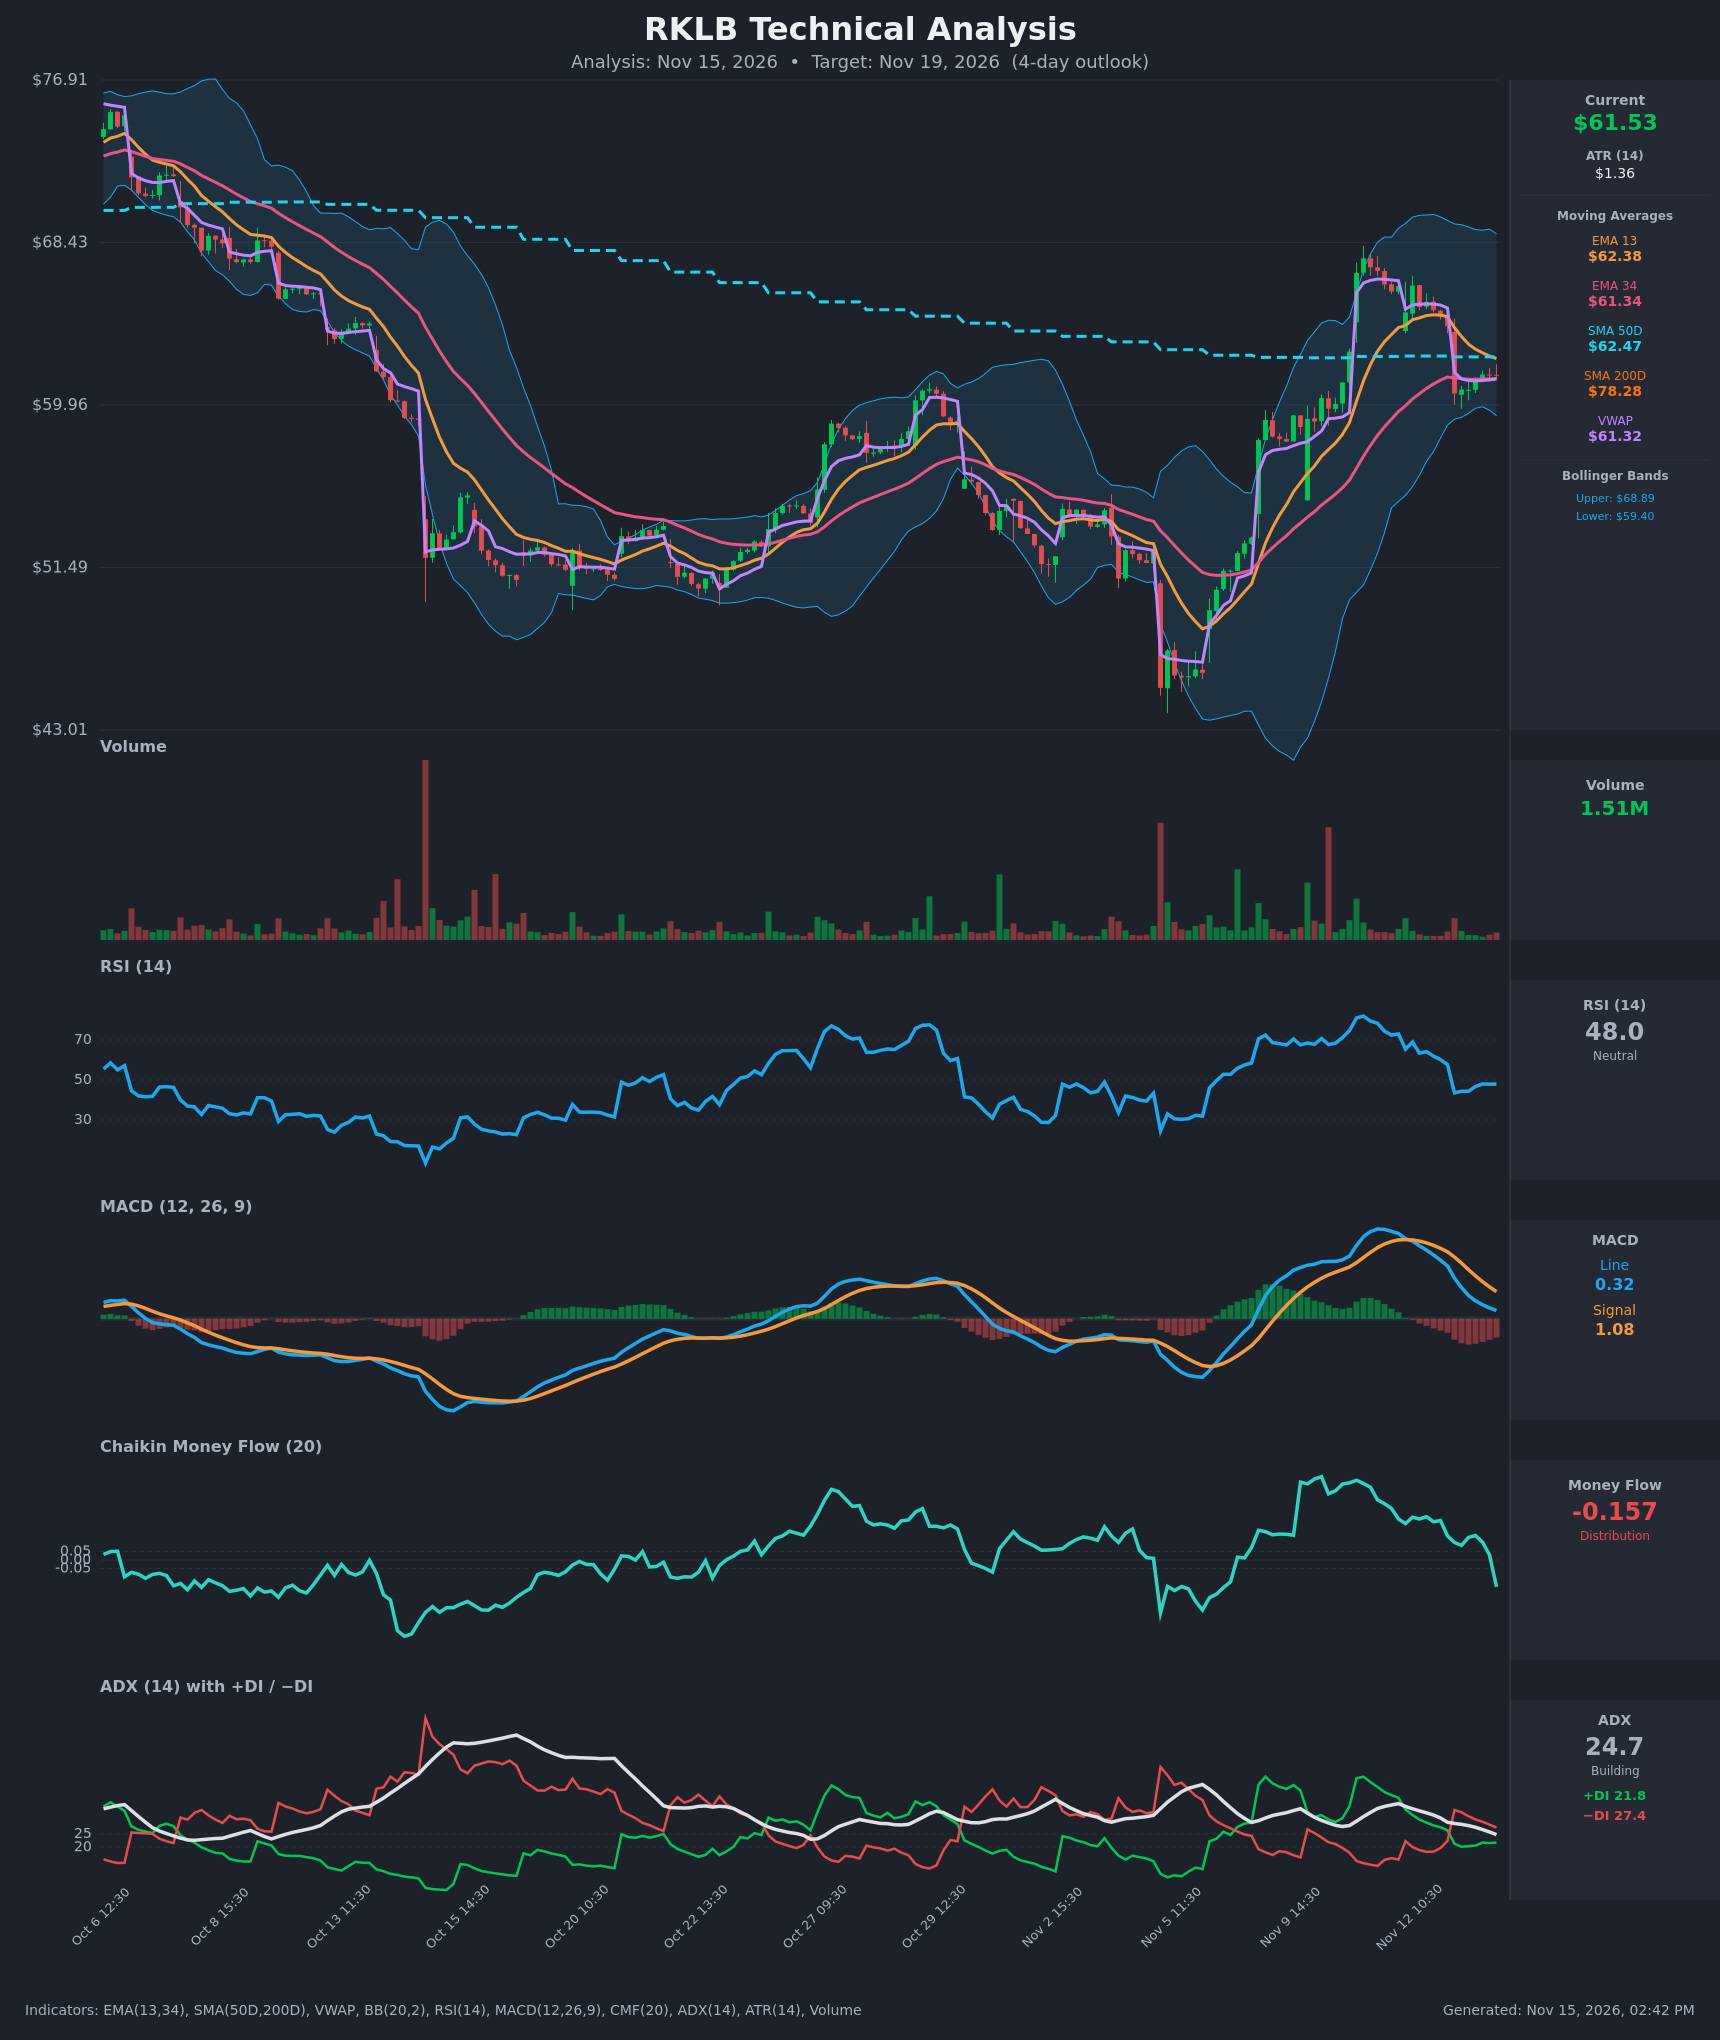
Analysis
TECHNICAL INDICATORS
- RSI (14): 47.95, down from 73 on Nov 11 and now sitting just under the 50 midline. Momentum has cooled sharply after the gap-down on Nov 13, and it has flattened around 44-48 since. [Neutral]
- EMA 13 / EMA 34: EMA 13 is $62.38 and EMA 34 is $61.34. Price at $61.53 is below the EMA 13, which is acting as resistance, and only just above the EMA 34. The EMA 13 is still above the EMA 34, but the gap has narrowed from about $4.4 to about $1, so a bearish cross is approaching. [Bearish]
- MACD: Line 0.32 is below Signal 1.08, a bearish crossover that happened on Nov 12. The histogram is negative at about -0.76, and both lines have rolled over from the 3+ peak. The histogram is still falling, though the rate of decline is slowing. [Bearish]
- Bollinger Bands (20): Upper $68.89, lower $59.40, with price at $61.53 in the lower half of the bands, below the midline (about $64.1). The bands are wide, so volatility is elevated. After the rejection from the upper band, price is drifting toward the lower band. [Bearish]
- CMF (20): -0.157, below the -0.05 distribution threshold. It has dropped from +0.25 to negative in a few sessions, a sharp swing from accumulation to selling pressure. [Distribution]
- ADX (14): 24.7 and falling from 36, with −DI (27.4) above +DI (21.8). The trend is losing strength but sits right at the threshold, with bears in control. [Moderate Trend, Bearish Direction]
- Volume: 1.51M, light compared with the spikes during the rally and the gap-down sessions. The post-gap consolidation is on low volume, so there is little conviction either way, though it is not showing aggressive dip-buying. [Neutral to Slightly Bearish]
DIVERGENCES & TRENDS
- No clear divergence. RSI, MACD and CMF all rolled over together with price after the Nov 12 high near $66.
- CMF dropped to -0.157 while price held flat around $61.5 for several bars. That is distribution beneath a stable surface, a mild bearish warning.
- MACD bearish crossover on Nov 12, and the line is heading toward zero.
- Price is below the SMA 50D ($62.47) and far below the SMA 200D ($78.28). The long-term trend is down, and a death-cross setup is already in place (SMA 50D well below SMA 200D).
- Price is hugging VWAP ($61.32) and the EMA 34 ($61.34), so $61.3 is the immediate pivot. A decisive break below it would expose the lower Bollinger Band near $59.40.
- DI: −DI crossed above +DI on Nov 13 and has stayed there, while ADX is decaying.
CHART PATTERNS
- The rally from about $44 to about $68 was followed by a sharp pullback and a tight sideways consolidation around $60.5-$61.6. This resembles a Bearish Flag/Pennant only loosely, since the preceding move was up. It is more a post-spike consolidation below the prior high.
- The failed push into the $66-68 area and the lower high relative to the earlier downtrend point to a possible Double Top-style reversal in the short term, with the $60.5 gap-low area as the neckline.
- A break below $60.5 would target roughly $58.5-$59.4, around the lower Bollinger Band and an ATR-based move. A reclaim of $62.5 (EMA 13 and SMA 50D) would invalidate the bearish read.
POTENTIAL SCENARIOS
- Scenario 1: Bearish Breakdown Below Consolidation — Distribution (CMF -0.157), a bearish MACD cross and −DI dominance favor a break below the $60.5 gap low, with price drifting toward the lower Bollinger Band. Trigger: hourly close below $60.50. Target: $58.80-$59.40. Invalidation: close above $62.50. (50% probability)
- Scenario 2: Neutral Range Chop — Price keeps oscillating between the EMA 34/VWAP support near $61.3 and the EMA 13/SMA 50D resistance near $62.4, as ADX fades and volume stays light. Trigger: failure to break either $60.50 or $62.50. Target: $60.80-$62.30. Invalidation: a decisive close outside the $60.50-$62.50 band. (28% probability)
- Scenario 3: Bullish Reclaim of Moving Averages — A bounce above the EMA 13 and SMA 50D, with RSI back above 50, leads to a retest of the mid-band. Trigger: close above $62.50 on rising volume. Target: $64.00-$64.50. Invalidation: loss of $61.30 VWAP/EMA 34. (22% probability)
PRICE TARGETS
For a 4-day horizon, the range width should be about 4-8% of price. I used about 6.9%.
- Target Price: $60.40 (4 trading days)
- Expected Range: $58.30 to $62.55 (width $4.25, about 6.9% of $61.535)
- Key Levels: Support at $59.40 (lower Bollinger Band; the nearer $60.50 gap low comes first), Resistance at $62.47 (SMA 50D / EMA 13 zone)
OVERALL BIAS
OVERALL BIAS: BEARISH - MACD is below its signal line, −DI is above +DI, CMF is in distribution at -0.157, and price is below the EMA 13, SMA 50D and SMA 200D. The tight consolidation just above the $60.50 gap low looks more likely to resolve down toward the lower Bollinger Band.
This is educational analysis and not financial advice.