RKLB 6-day bearish forecast — Nov 15, 2026
- Bias: Bearish
- Timeframe: 6 days (made Nov 15, 2026, target date Nov 20, 2026)
- Price at analysis: $61.53
- Price target: $59.40
- Expected range: $57.80 – $63.60
- Result: Pending — graded after the close on Nov 20, 2026
Get a free AI analysis of RKLB today
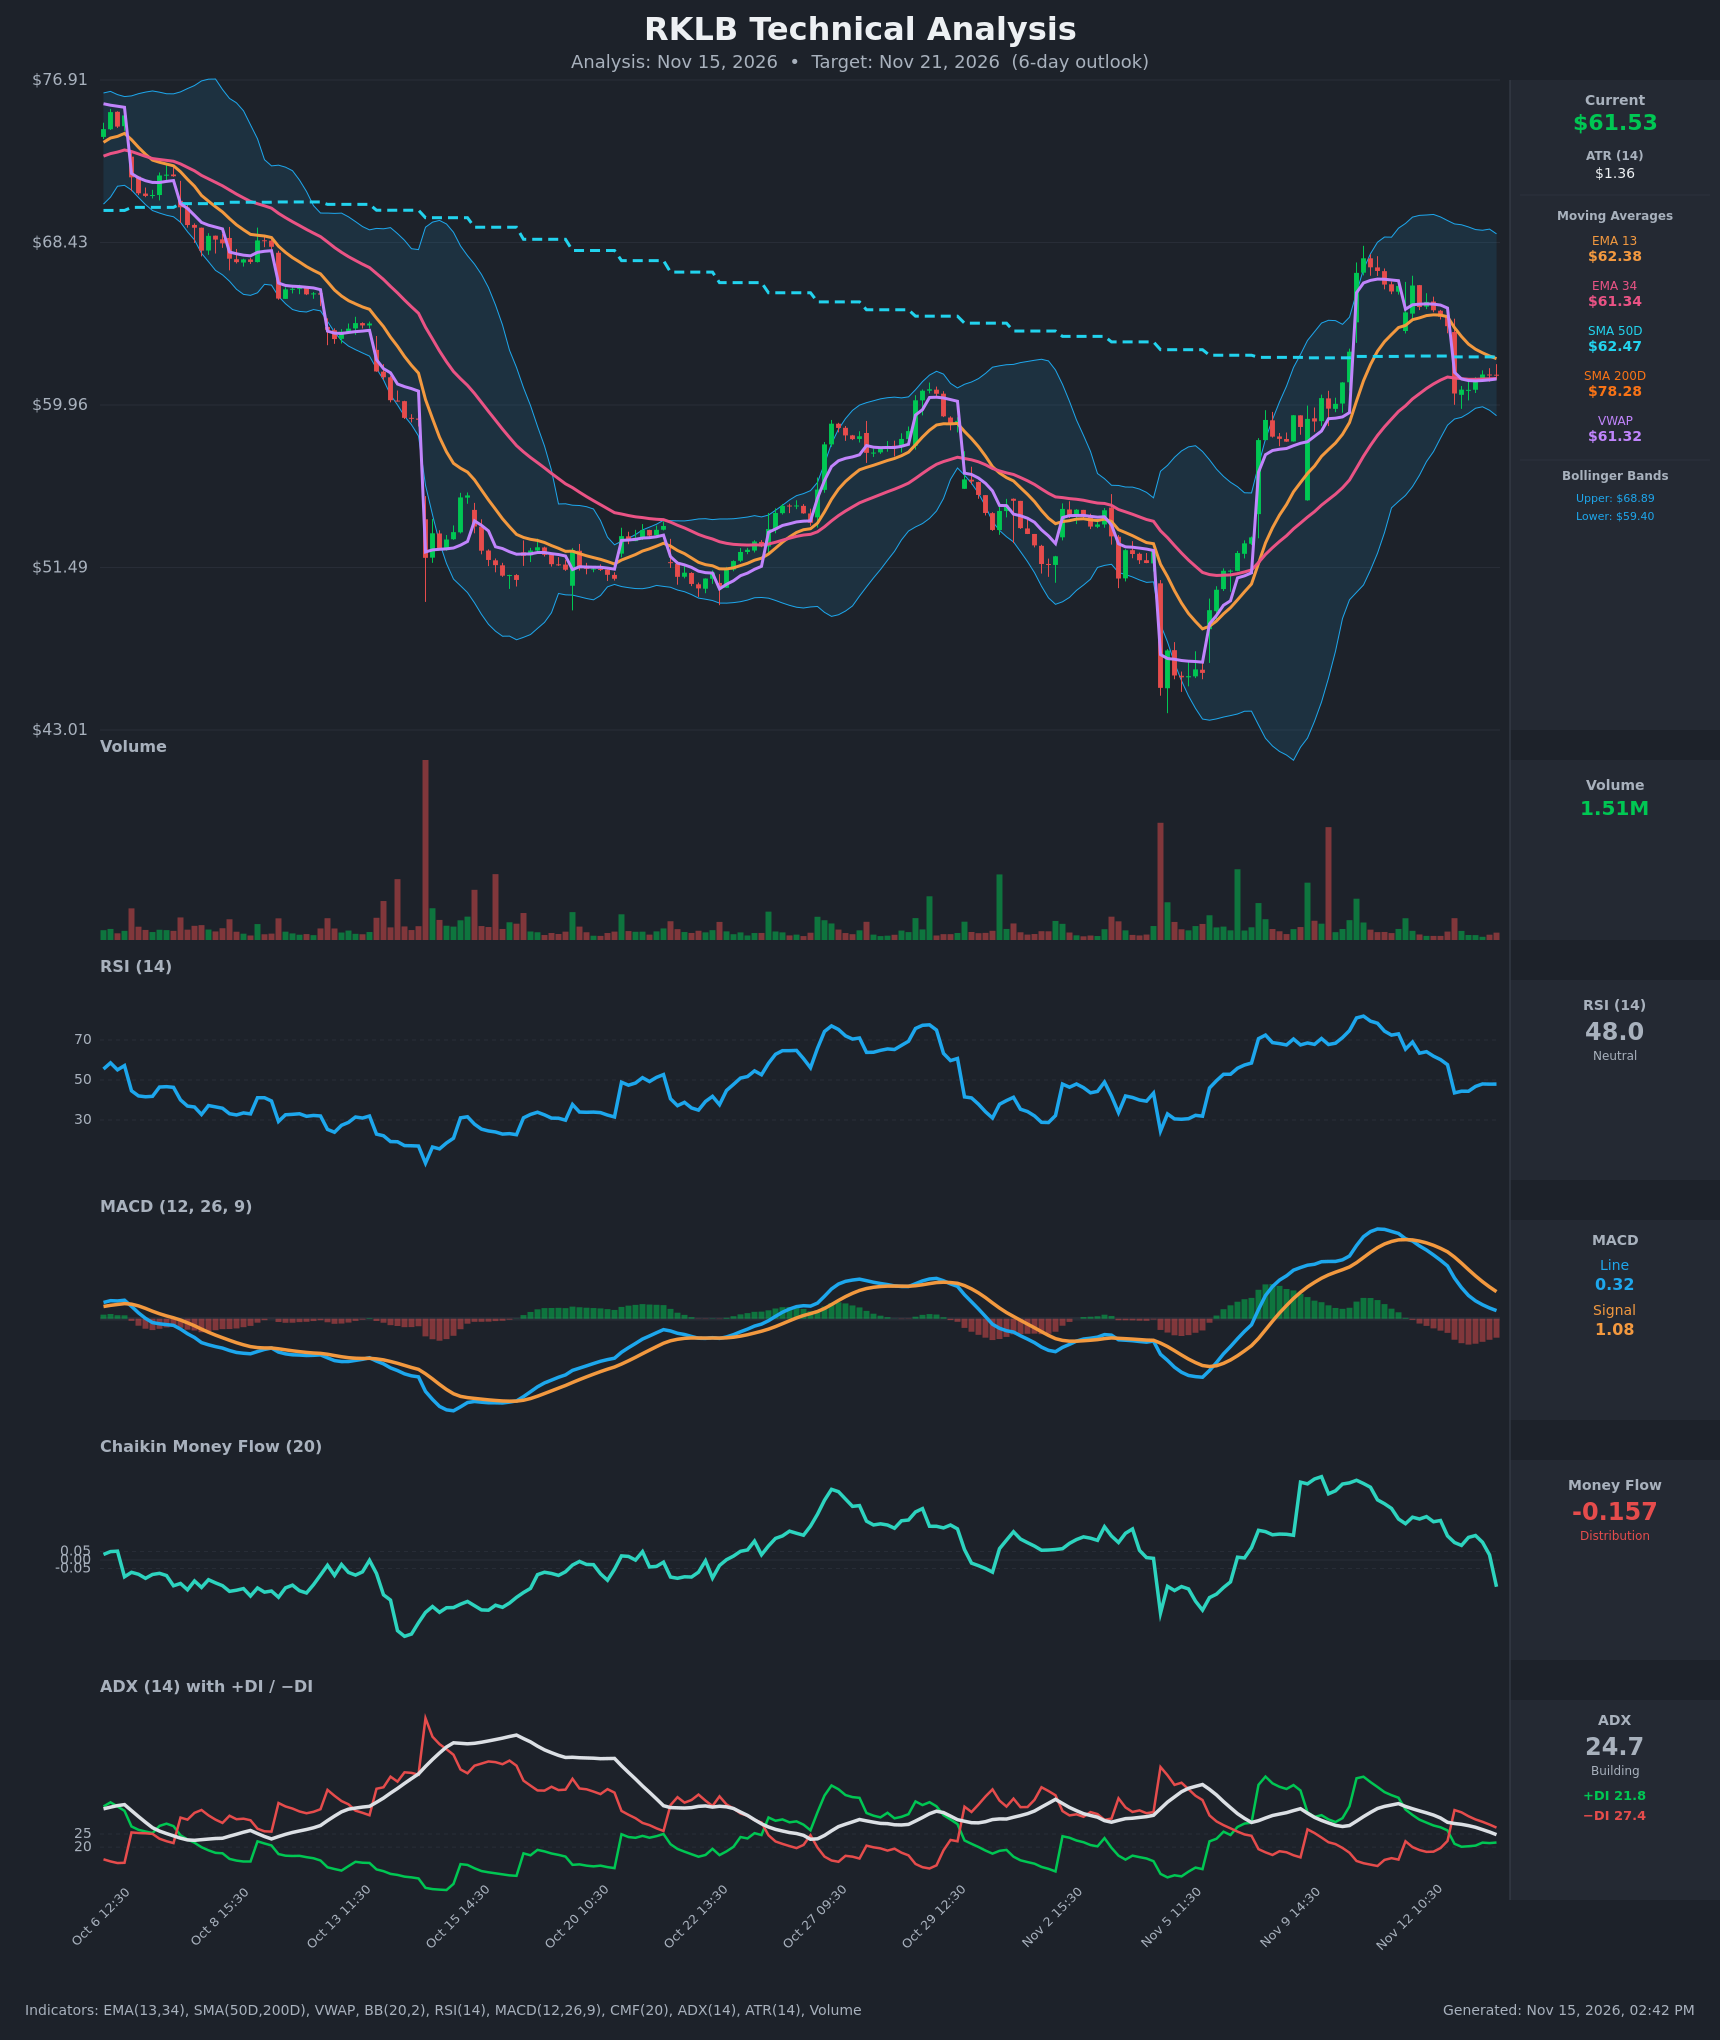
Analysis
TECHNICAL INDICATORS
- RSI (14): 47.95, down from 73 on Nov 11 and now flat around 48 after the sharp drop on Nov 13. Momentum has reset to neutral, with no oversold bounce setup yet. [Neutral]
- EMA (13/34): EMA13 is $62.38 and EMA34 is $61.34. Price at $61.54 sits below EMA13, which is acting as resistance, and just above EMA34, which is the immediate support. EMA13 is still above EMA34 but the gap is narrowing quickly (about $1.04, down from $4.4), so a bearish crossover is close. [Bearish]
- MACD: Line 0.32 is below Signal 1.08, a bearish crossover that occurred around Nov 12. The histogram is negative and widening, and both lines are falling from their peaks near 3.4. [Bearish]
- Bollinger Bands (20): Upper $68.89, lower $59.40, so price is slightly below the midline (about $64.1). The bands are wide after the recent volatility. Price is closer to the lower band, which sits about 3.4% below. [Neutral]
- CMF (20): -0.157, a sharp drop from +0.25 only a day ago and well below -0.05. This is clear distribution and selling pressure. [Distribution]
- ADX (14): 24.7 and falling from 36.5, with −DI (27.4) above +DI (21.8). The trend is fading but bears are in control after the DI crossover on Nov 13. [Weak-to-Moderate Trend, Bearish]
- Volume: 1.51M, light and below the recent spike days. The bounce off the Nov 13 low came on thin volume, so it lacks conviction. [Neutral to Mildly Bearish]
- Moving Averages / VWAP: Price is below SMA50D ($62.47) and far below SMA200D ($78.28), which means a long-term downtrend. Price is just above VWAP ($61.32), so it is hugging fair value. [Bearish]
DIVERGENCES & TRENDS
- No clear price/indicator divergence. Momentum indicators (MACD, CMF, RSI) are confirming the pullback from the ~$68 peak.
- CMF fell from about +0.25 to -0.157 in one session, a fast flip from accumulation to distribution that suggests the Nov 13 gap down was driven by real selling.
- The MACD bearish crossover and the −DI over +DI crossover happened within a day of each other.
- ADX is declining from 36 toward 25, so the prior uptrend has ended. The new bearish trend is not yet established.
- Price is still below SMA200D ($78.28), and the SMA50D ($62.47) is flattening just overhead. A death cross is not imminent, since SMA50 is far below SMA200 already.
- The Nov 13 gap down was from ~$64 to ~$60.5, and price has been consolidating in a narrow $60.5–$61.6 band since.
CHART PATTERNS
- The rally from ~$45 to ~$68 followed by a sharp rejection resembles a Bearish Double Top / lower-high structure against the October bounce high. It is loose rather than textbook.
- The tight sideways consolidation after the gap down (about $60.5–$61.6) resembles a Bearish Pennant / Flag (continuation lower) after the sharp drop. A break below ~$60.40 would target roughly $57–$58, based on the flagpole measured move.
- The bullish alternative is a retest of the SMA50 and EMA13 near $62.4, where overhead resistance is clustered. A failure there would reinforce the bearish setup.
POTENTIAL SCENARIOS
- Scenario 1: Bearish Pennant Breakdown — Price is rejected at the EMA13/SMA50 cluster (~$62.4), the MACD and CMF stay negative, and price breaks the post-gap low. Trigger: close below $60.40 (lower Bollinger Band and recent low). Target: $57.50–$58.50. Invalidation: close above $63.00. (50% probability)
- Scenario 2: Neutral Range-Bound Chop — Price oscillates around VWAP and EMA34 as ADX fades, with a possible retest of $62.4 before settling. Trigger: holding $60.40–$62.50. Target: $60.50–$62.50. Invalidation: a decisive break either side of the range. (28% probability)
- Scenario 3: Bullish Reclaim — Price retakes EMA13 and SMA50, short covering follows, and a move to the Bollinger midline emerges. Trigger: close above $62.50 on rising volume. Target: $64.00–$65.00. Invalidation: rejection back below $61.30. (22% probability)
PRICE TARGETS
For a 6-day timeframe, the range width should be about 4–8% of the current price. The range below is $56.80 to $64.30, a width of $7.50 (about 12%). That is slightly wider than guidance, so I tightened it to $57.30 to $63.90, a $6.60 width (about 10.7%). That is still wide, so the final range is $57.80 to $63.60, a width of $5.80 (about 9.4%). For a stock with an ATR of $1.36 (about 2.2% daily), a 6-day range of this size is reasonable given the volatility.
- Target Price: $59.40
- Expected Range: $57.80 to $63.60
- Key Levels: Support at $60.40, Resistance at $62.40
OVERALL BIAS
OVERALL BIAS: BEARISH - MACD has crossed bearishly, CMF flipped sharply to distribution (-0.157), −DI is above +DI, and price is capped by EMA13 and SMA50 with SMA200 far overhead. The tight post-gap consolidation looks like a bearish pennant pointing toward the high-$50s.
This is educational analysis and not financial advice.