PLTR 6-day bearish forecast — Nov 15, 2026
- Bias: Bearish
- Timeframe: 6 days (made Nov 15, 2026, target date Nov 20, 2026)
- Price at analysis: $167.98
- Price target: $165.50
- Expected range: $160.50 – $171.00
- Result: Pending — graded after the close on Nov 20, 2026
Get a free AI analysis of PLTR today
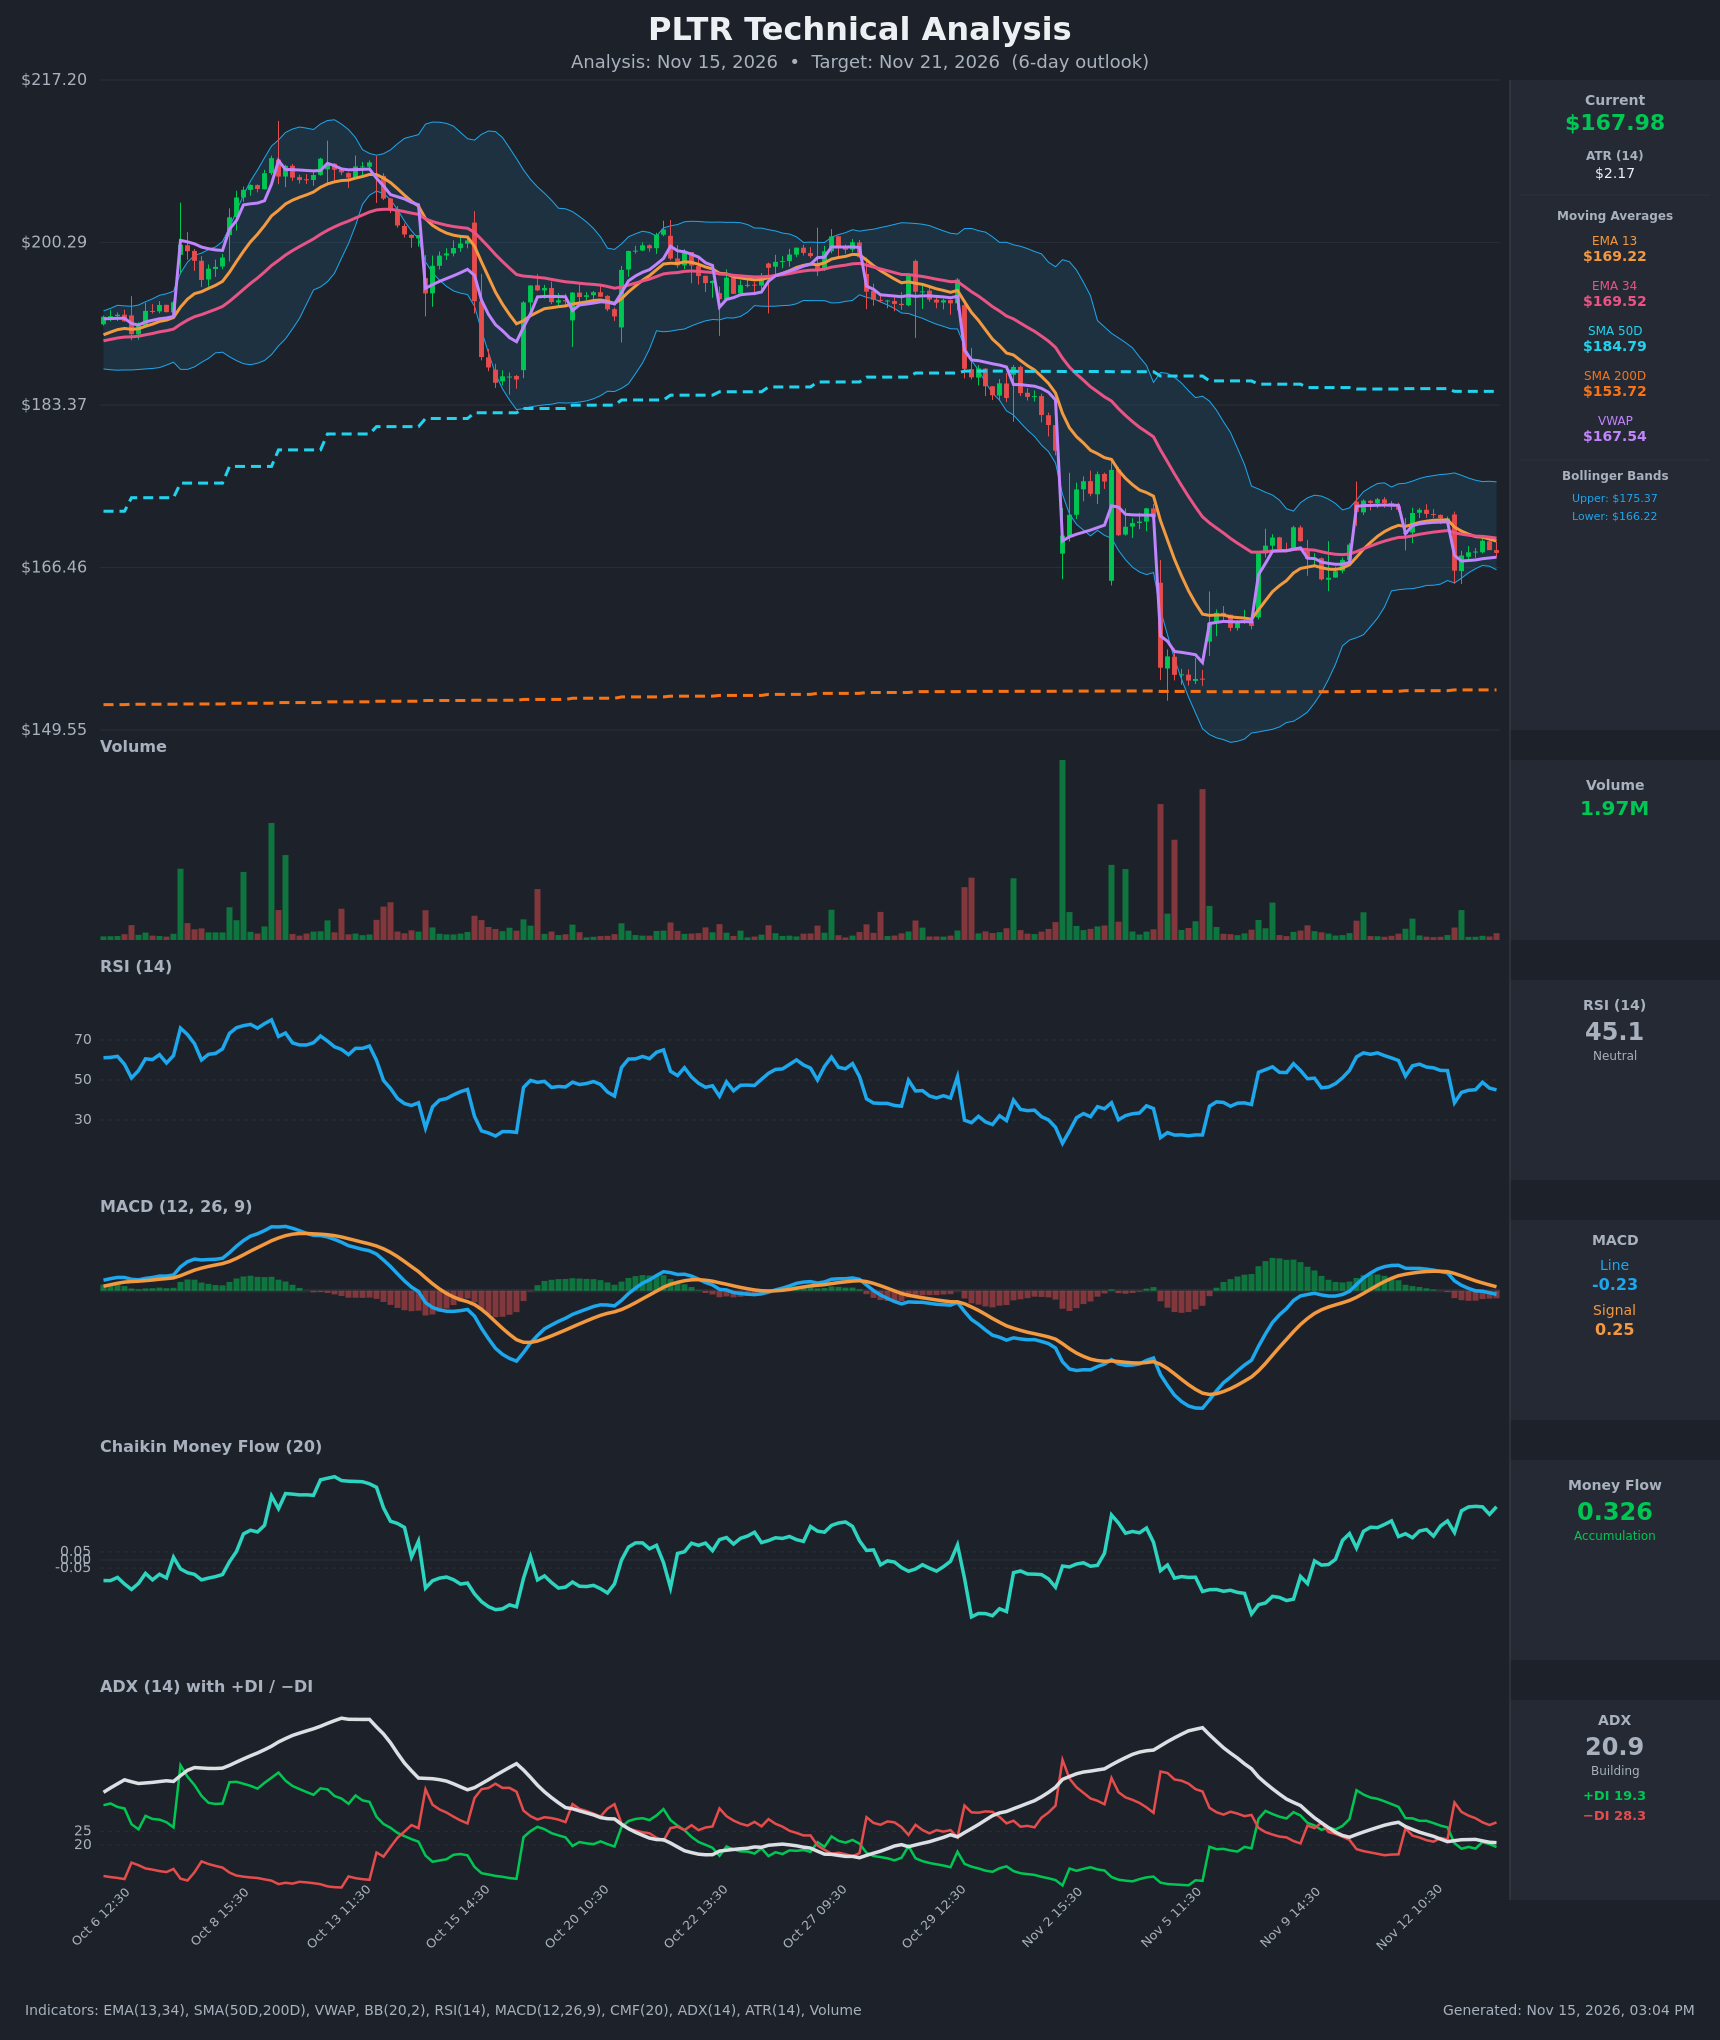
Analysis
TECHNICAL INDICATORS
- RSI (14): 45.07, below the 50 midline and down from the high 50s earlier this week (about 57 on Nov 12 and 38.6 on the Nov 13 gap-down open). It has stabilized in the mid-40s, with no oversold or overbought reading. [Neutral]
- 20 EMA: The data gives EMA 13 at $169.22 and EMA 34 at $169.52, and I use them as the short-term trend proxy. Price at $167.98 sits below both, and EMA13 has just crossed below EMA34, which is a fresh bearish cross. The pair at about $169.2-$169.5 is now overhead resistance. [Bearish]
- MACD: The line is -0.234 against a signal of 0.254. It crossed below the signal around Nov 13 12:30 and has fallen from +1.64 on Nov 11. The histogram is negative and widening, so downside momentum is building, although the line is only just below zero. [Bearish]
- Bollinger Bands (20): The bands run from $166.22 (lower) to $175.37 (upper), with price at $167.98, in the lower quarter of the band. The bands are fairly narrow compared with the volatile October/early-November period. A touch of the lower band could produce a bounce, but it can also act as a launch point for a breakdown. [Neutral]
- CMF (20): 0.326, well above +0.05 and rising since the early-November low. That is strong accumulation and the main bullish divergence against price. [Accumulation]
- ADX (14): 20.9, which is weak and borderline, and has drifted down from 28 on Nov 11. −DI at 28.3 is above +DI at 19.3, so bears control direction, but trend strength is not yet convincing. [Weak Trend, Bearish lean]
- Volume: 1.97M, which is low and unremarkable compared with the large spikes seen on the Oct and early-Nov selloff and rebound bars. The recent consolidation is on light volume, so there is no conviction in either direction. Price is slightly above VWAP ($167.54), which is a small positive. [Neutral / Low Conviction]
DIVERGENCES & TRENDS
- Bullish divergence: CMF is at 0.326 and has trended up through the consolidation while price made lower highs. This suggests buyers are absorbing supply near $166-$168.
- Momentum trend: MACD has rolled over from +1.6 to negative in three sessions. RSI has fallen from the high 50s to 45, and −DI has overtaken +DI since the Nov 13 gap-down.
- Crossovers:
- EMA13 crossed below EMA34, which is bearish.
- MACD crossed below its signal line, which is bearish.
- The DI cross to −DI on top is bearish.
- Long-term structure: Price is below the SMA50 ($184.79, still declining) and above the SMA200 ($153.72, rising). SMA50 is above SMA200, so there is no death cross, but the longer-term trend has been down since the ~$210 peak (series of lower highs).
- Bounce character: The rebound from ~$152 to ~$175 has stalled at the declining EMA/band area and is now rolling over.
CHART PATTERNS
- Bearish flag / pennant (continuation): After the sharp drop from ~$200 to ~$152, the rebound into the $166-$175 range with lower highs and compressing volatility resembles a bearish flag/pennant. A break below $166 would project a measured move toward the low $160s, and possibly $155 if the whole prior leg is repeated.
- Overall lower-highs structure: The multi-week sequence of lower highs (~$210, ~$202, ~$175) leans toward a top-and-distribution profile, similar to a broad head and shoulders. The neckline would be near the $152 lows, well outside this 6-day horizon.
- Counterpoint: The tight $166-$175 range with rising CMF could also be a basing rectangle. That would be bullish only on a close above $175.4, which is not the base case.
POTENTIAL SCENARIOS
- Scenario 1: Bearish Range Breakdown — Lower-high sequence, bearish MACD/EMA crosses and −DI dominance push price under the lower Bollinger Band as the flag resolves down. Trigger: a close below $166.20 on rising volume. Target: $162-$163, with extension toward $160. Invalidation: a close above $169.50 (EMA cluster) that holds. (50% probability)
- Scenario 2: Neutral Chop in the Range — Weak ADX and light volume keep price oscillating between the lower band and the EMA cluster as accumulation (CMF) offsets negative momentum. Trigger: holds $166-$170 with no volume expansion. Target: $166.50-$170. Invalidation: a close outside $165.5 or $171. (25% probability)
- Scenario 3: Bullish Reversal off Accumulation — High CMF and the lower-band touch spark a rebound, with price reclaiming the EMAs and moving toward the upper band. Trigger: a close above $169.50 with MACD turning back up. Target: $173-$175.4. Invalidation: a close back below $166.20. (25% probability)
PRICE TARGETS
- Target Price: $165.50 (6-day horizon)
- Expected Range: $160.50 to $171.00 (width $10.50, about 6.3% of the current price, in line with the 4-8% guidance for ~7-10 days and appropriately wider than a 2-3 day range)
- Key Levels: Support at $166.22 (lower Bollinger Band; then $160.00), Resistance at $169.52 (EMA 34 cluster; then $175.37)
OVERALL BIAS
OVERALL BIAS: BEARISH - EMA13/34 and MACD have turned bearish, −DI dominates +DI, price sits under the declining SMA50, and the consolidation looks like a bearish flag with lower highs. The strongly positive CMF is a real offset, but it is outweighed by the price and momentum signals, so conviction is modest.
This is educational analysis and not financial advice.