PLTR 4-day bearish forecast — Nov 15, 2026
- Bias: Bearish
- Timeframe: 4 days (made Nov 15, 2026, target date Nov 18, 2026)
- Price at analysis: $167.98
- Price target: $166.20
- Expected range: $163.80 – $171.00
- Result: Pending — graded after the close on Nov 18, 2026
Get a free AI analysis of PLTR today
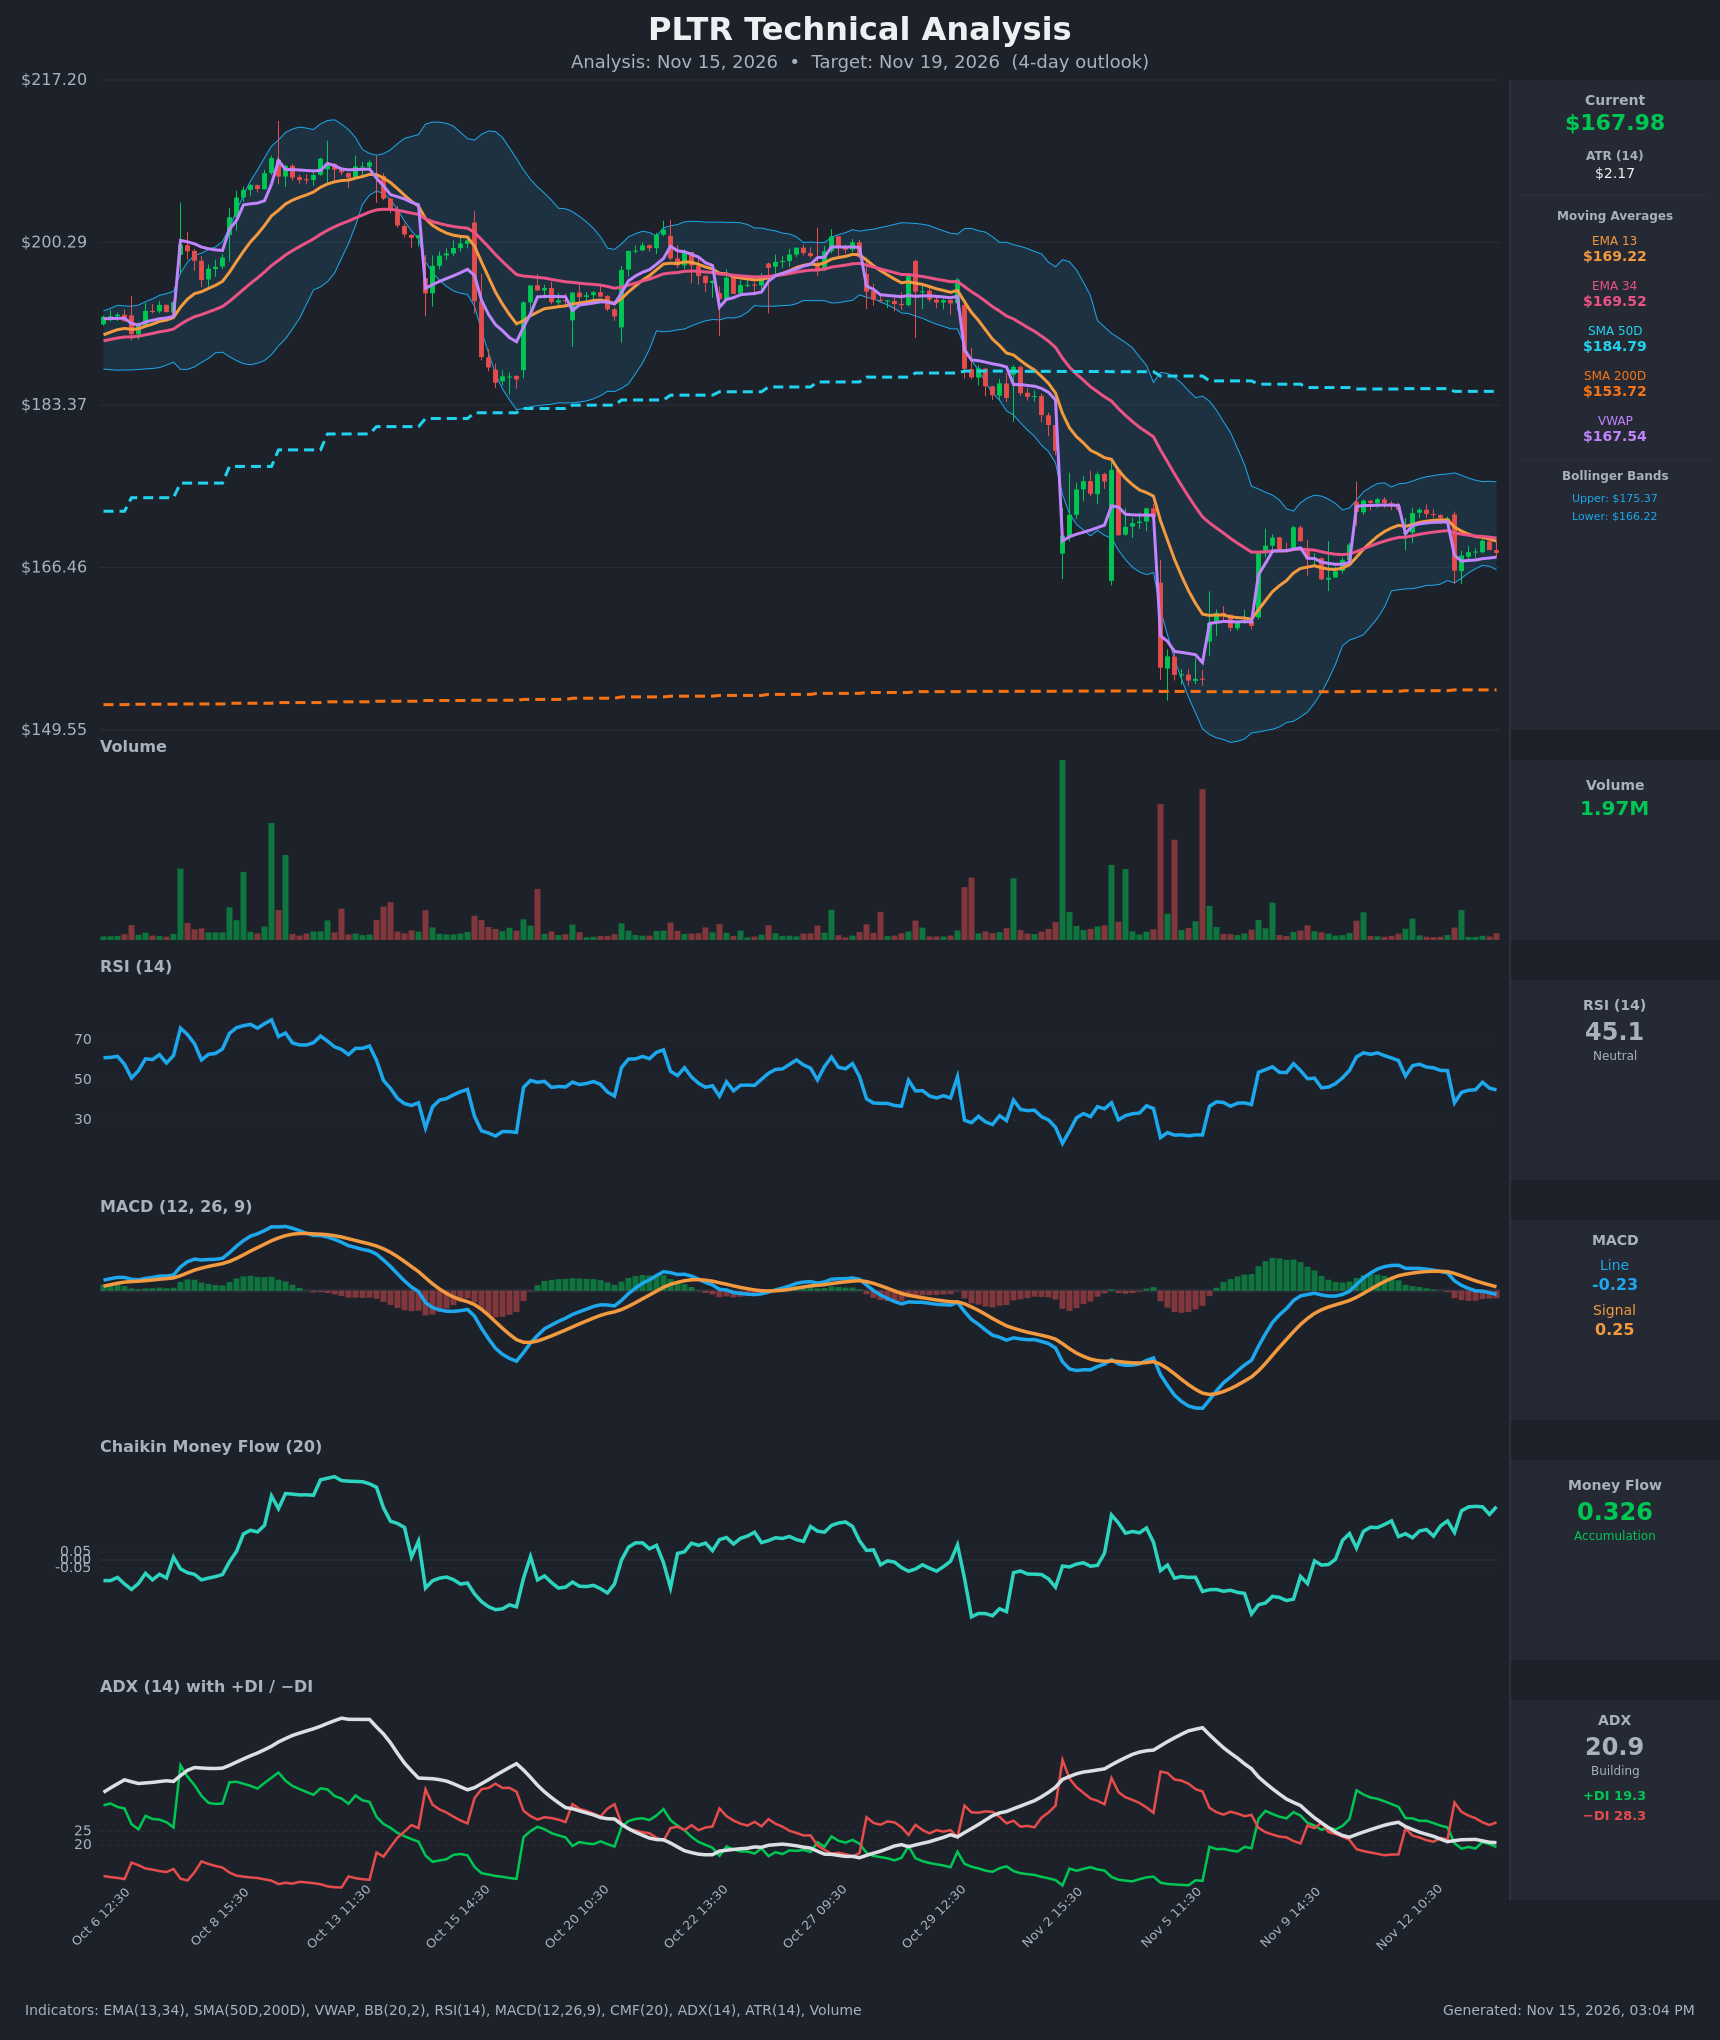
Analysis
TECHNICAL INDICATORS
- RSI (14): 45.07, below the 50 midline after falling from 59.7 on Nov 11 and bottoming near 38.6 on the Nov 13 gap-down. It has recovered only partly and is stalling in the mid-40s. Momentum is soft but not oversold. [Bearish]
- 20 EMA (EMA 13 / EMA 34 provided): EMA 13 is $169.22 and EMA 34 is $169.52. Price at $167.98 sits below both. EMA 13 crossed below EMA 34 around Nov 13 13:30, a short-term bearish cross. The cluster around $169.2–169.5 is now overhead resistance. [Bearish]
- MACD: The line (-0.234) crossed below the signal (0.254) on Nov 13 12:30–13:30 and has dropped below zero. The histogram is negative and widening, so short-term momentum has turned down. [Bearish]
- Bollinger Bands (20): Upper $175.37, lower $166.22. Price is in the lower quarter of the bands, about $1.76 above the lower band. The bands are narrowing after the volatile November drop, which points to a compression or consolidation phase. A drift to the lower band is possible, but the band offers some support. [Neutral]
- CMF (20): 0.326, well above +0.05 and sustained for several sessions. This is strong accumulation and the main bullish counterpoint to the weak price action. It suggests dips are being bought. [Accumulation]
- ADX (14): 20.9, at the weak/range-bound threshold and falling from 28 on Nov 11. −DI (28.3) is above +DI (19.3), so bears have directional control, but the trend is not strong. [Weak Trend, bearish lean]
- Volume: 1.97M, a low, quiet reading compared with the heavy spikes seen during the Nov 5–6 selloff. The decline has no fresh capitulation or selling pressure, but there is also no strong buying confirmation. [Neutral / low conviction]
DIVERGENCES & TRENDS
- CMF vs. price: This is a bullish divergence. CMF has climbed to 0.326 while price made lower lows and then chopped sideways. Money flow suggests accumulation that has not yet shown up in price.
- RSI and MACD vs. price: These are confirming the short-term downturn, with an RSI rollover from the high 50s and a MACD bearish crossover.
- Moving averages: The EMA 13/34 bearish cross is fresh, but the two EMAs are only $0.30 apart, which signals chop rather than a strong trend.
- Long-term structure: Price is below the SMA50 ($184.79, still falling), which is a bearish intermediate trend. It is above the SMA200 ($153.72), so the long-term uptrend is intact. There is no golden or death cross.
- VWAP: Price is slightly above VWAP ($167.54), which is a minor support.
- ADX: The ADX decline from 28 to 21 shows the sharp sell-off trend losing steam. The market is moving into a consolidation range of roughly $166–$172.
CHART PATTERNS
- Bearish Pennant / Flag (continuation) and Descending Triangle (loose fit): After the steep decline from about $210 to the $150 low, price has rebounded and is now consolidating in a narrowing range of about $166–$172 with lower highs. This resembles a bearish continuation consolidation. The measured downside target is a break below $166 toward $163–$164, and potentially lower on a larger measured move.
- Counter-view: The tight range above the SMA200, with positive CMF, could also be a base. A move above $172 would negate the bearish consolidation.
- No clean reversal pattern such as a double bottom or head and shoulders is confirmed.
POTENTIAL SCENARIOS
- Scenario 1: Bearish Break of Range Support — Price remains capped under the EMA 13/34 cluster, with the bearish MACD and −DI dominance continuing. It drifts to the lower Bollinger Band and then breaks $166. Trigger: a close below $166.00 on rising volume. Target: $163.50–$164.50. Invalidation: a close above $169.60 (EMA 34). (45% probability)
- Scenario 2: Bullish Accumulation Bounce — The strong CMF accumulation drives a bounce off the lower band and VWAP. Price reclaims the EMAs and retests the upper range. Trigger: a hold above $166.20 and a push through $169.50. Target: $171.50–$172.50. Invalidation: a close below $165.50. (35% probability)
- Scenario 3: Neutral Range Chop — Weak ADX and narrowing bands keep price pinned between about $166 and $169.50. Trigger: failed breaks of both boundaries. Target: $167–$168.50. Invalidation: a decisive close outside the $165.50–$170.00 zone. (20% probability)
PRICE TARGETS
- Target Price: $166.20 (4-day, Nov 19)
- Expected Range: $163.80 to $171.00. This is a $7.20 width, about 4.3% of the current price, appropriate for a 4-day horizon.
- Key Levels: Support at $166.00 (lower Bollinger Band and recent low area), Resistance at $169.50 (EMA 34 / EMA 13 cluster)
OVERALL BIAS
OVERALL BIAS: BEARISH - The MACD bearish crossover, EMA 13/34 bearish cross, price below both EMAs and the falling SMA50, RSI below 50 and −DI above +DI together outweigh the bullish CMF accumulation. Conviction is modest, since ADX is weak and price is near lower-band support, so a bounce remains a meaningful risk.
This is educational analysis and not financial advice.