QBTS 6-day bearish forecast — Nov 15, 2026
- Bias: Bearish
- Timeframe: 6 days (made Nov 15, 2026, target date Nov 20, 2026)
- Price at analysis: $9.55
- Price target: $9.25
- Expected range: $8.85 – $9.85
- Result: Pending — graded after the close on Nov 20, 2026
Get a free AI analysis of QBTS today
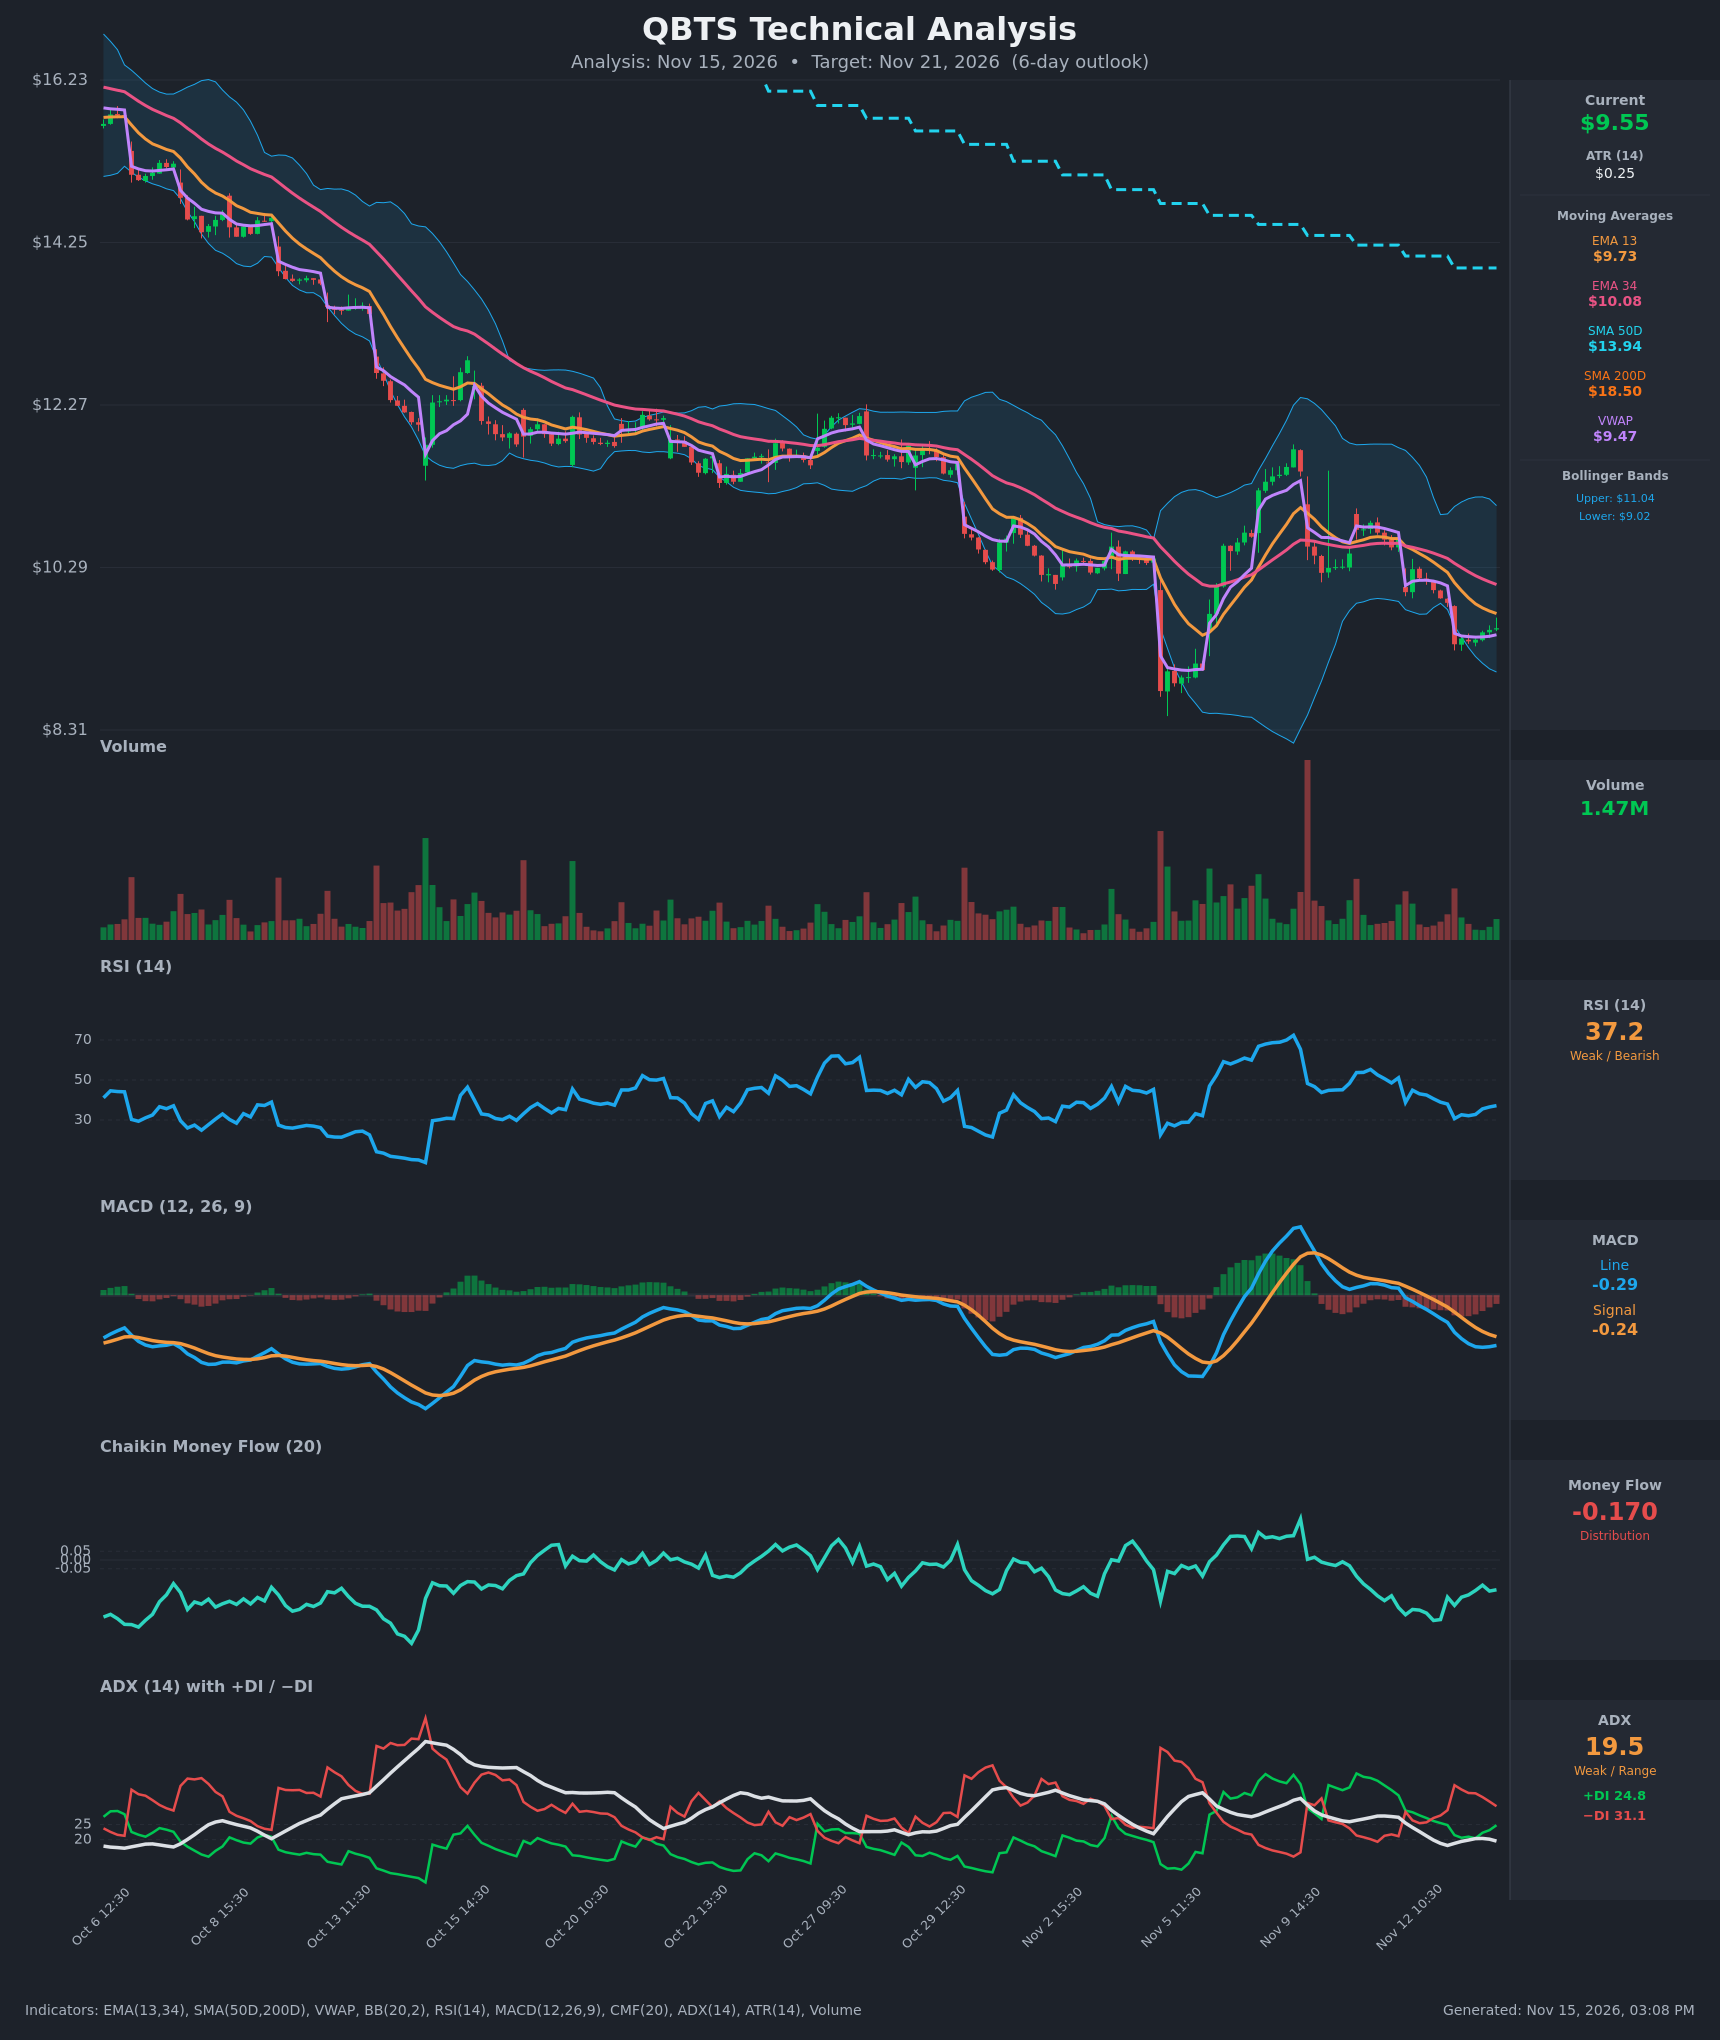
Analysis
TECHNICAL INDICATORS
- RSI (14): 37.18, below 50 and approaching oversold but not there yet. It bounced from 30.7 to 37.2 over the last few bars, so downside momentum is easing but the trend is still weak. [Bearish]
- EMA 13 / EMA 34: EMA 13 is $9.73 and EMA 34 is $10.08. Price at $9.55 is below both, and EMA 13 is below EMA 34 (bearish alignment since Nov 12). The EMAs are overhead resistance. [Bearish]
- MACD: Line -0.287 is below Signal -0.237, both negative, and the histogram is negative. The line has flattened and is starting to curl up (-0.298 → -0.287), so the gap is narrowing, but there is no bullish cross yet. [Bearish]
- Bollinger Bands (20): Upper $11.04, lower $9.02, so price sits in the lower third of the bands about $0.53 above the lower band. The bands are wide after the Nov 5–9 volatility swing. A mean-reversion bounce toward the midline (~$10.03) is possible, but there is no squeeze. [Neutral/Bearish]
- CMF (20): -0.170, well below -0.05, so selling pressure is persistent. It has been negative since Nov 11 and improved only slightly from -0.346. [Distribution]
- ADX (14): 19.5 with −DI 31.1 above +DI 24.8. The trend is weak by ADX, but the directional bias favors bears. +DI has been recovering from 20.5 and the gap is narrowing. [Weak Trend, Bearish Direction]
- Volume: 1.47M, light and fading on the recent bounce, with no capitulation spike. The big-volume days were on the Nov 5 flush and the Nov 9 spike. Light-volume stabilization is not enough to confirm a reversal. [Neutral/Weak Conviction]
- VWAP / SMAs: Price is $9.55 against VWAP $9.47, slightly above, which is a minor short-term support. The price is far below the SMA50D ($13.94) and SMA200D ($18.50), with a death cross already in place. This is a deep long-term downtrend. [Bearish]
DIVERGENCES & TRENDS
- Price has made lower lows and lower highs from the mid-$16s down to $9.55 in a persistent downtrend, a series of stair-step declines.
- RSI made a higher low versus the Nov 5 low (~25), but the current RSI of 37 is lower than the Nov 12 peak of ~53. This is a weak, unconfirmed positive sign, not a true divergence.
- MACD momentum is flattening, with the line curling up while still below Signal. A bullish cross in the next few sessions is possible if price holds.
- DI spread is narrowing (−DI fell from 38 to 31, +DI rose from 20.5 to 24.8), suggesting selling pressure is easing slightly.
- The EMA 13/34 bearish alignment is intact, and the price rejected the EMAs after the Nov 9 spike.
- CMF stays strongly negative, which contradicts a sustained recovery.
CHART PATTERNS
- Long-term: A persistent descending channel / sequence of lower highs and lower lows is the dominant structure. It resembles a bearish continuation (descending-type structure) rather than a reversal.
- Near-term: The Nov 5 low (~$8.7–9.0) followed by the Nov 9 spike to ~$11.7 and rollover looks like a failed rebound, forming a lower high. Price is now retesting the lower region near the Bollinger lower band and the Nov 5 low. A Bearish Rising Wedge / failed rally reading applies on the bounce, with a rollover below EMA support.
- Potential support test: If $9.0 holds, a Bullish Double Bottom with the Nov 5 low could form. It would need a break above ~$10.1 to confirm, and that is not in place.
- A break below $9.0 would target the Nov 5 low zone, around $8.5–8.7.
POTENTIAL SCENARIOS
- Scenario 1: Bearish Continuation Lower — Price stays below the EMA 13/34 and VWAP, retests the lower Bollinger Band and the Nov 5 low zone with persistent distribution. Trigger: Break below $9.40 and then the $9.02 lower band. Target: $8.85–$9.00, extending to $8.60 on a breakdown. Invalidation: Close above $10.10 (EMA 34). (50% probability)
- Scenario 2: Neutral Consolidation / Low Bounce — Price chops between the $9.00 support and the $9.75 EMA 13 as selling exhaustion offsets weak buying. Trigger: Holds $9.20 on light volume. Target: $9.30–$9.75. Invalidation: Close outside $9.00–$10.00. (20% probability)
- Scenario 3: Bullish Relief Bounce — Oversold-ish RSI and a narrowing MACD gap trigger a mean-reversion bounce toward the EMAs and the Bollinger midline. Trigger: Reclaim $9.75 (EMA 13) with rising volume and a MACD cross. Target: $10.05–$10.30. Invalidation: Close below $9.10. (30% probability)
PRICE TARGETS
For the 6-day timeframe (range width should be ~4–8% of price, ideally ~7% given the elevated volatility and the wide bands):
- Target Price: $9.25 (bearish bias, about -3.1%)
- Expected Range: $8.85 to $9.85 (width $1.00 ≈ 10.5% of price)
- Key Levels: Support at $9.02, Resistance at $9.73
Self-check: the width of $1.00 (~10.5%) is slightly above the 7–10 day guide of 4–8%, justified by an ATR of $0.25 (≈2.6%) and the wide Bollinger Bands. The 6-day range is wider than a 2–3 day range would be. The target is below the current price, consistent with the bearish bias.
OVERALL BIAS
OVERALL BIAS: BEARISH - Price is below the EMA 13/34, VWAP-adjacent, and far below the declining SMA50/200 (death cross), with MACD below Signal, −DI above +DI, and CMF at -0.17 showing persistent distribution. Easing RSI and a narrowing MACD gap make a relief bounce to ~$9.75 possible, but the weight of evidence favors a drift lower toward the $9.0 support zone.
This is educational analysis and not financial advice.