QBTS 4-day bearish forecast — Nov 15, 2026
- Bias: Bearish
- Timeframe: 4 days (made Nov 15, 2026, target date Nov 18, 2026)
- Price at analysis: $9.55
- Price target: $9.25
- Expected range: $8.85 – $9.80
- Result: Pending — graded after the close on Nov 18, 2026
Get a free AI analysis of QBTS today
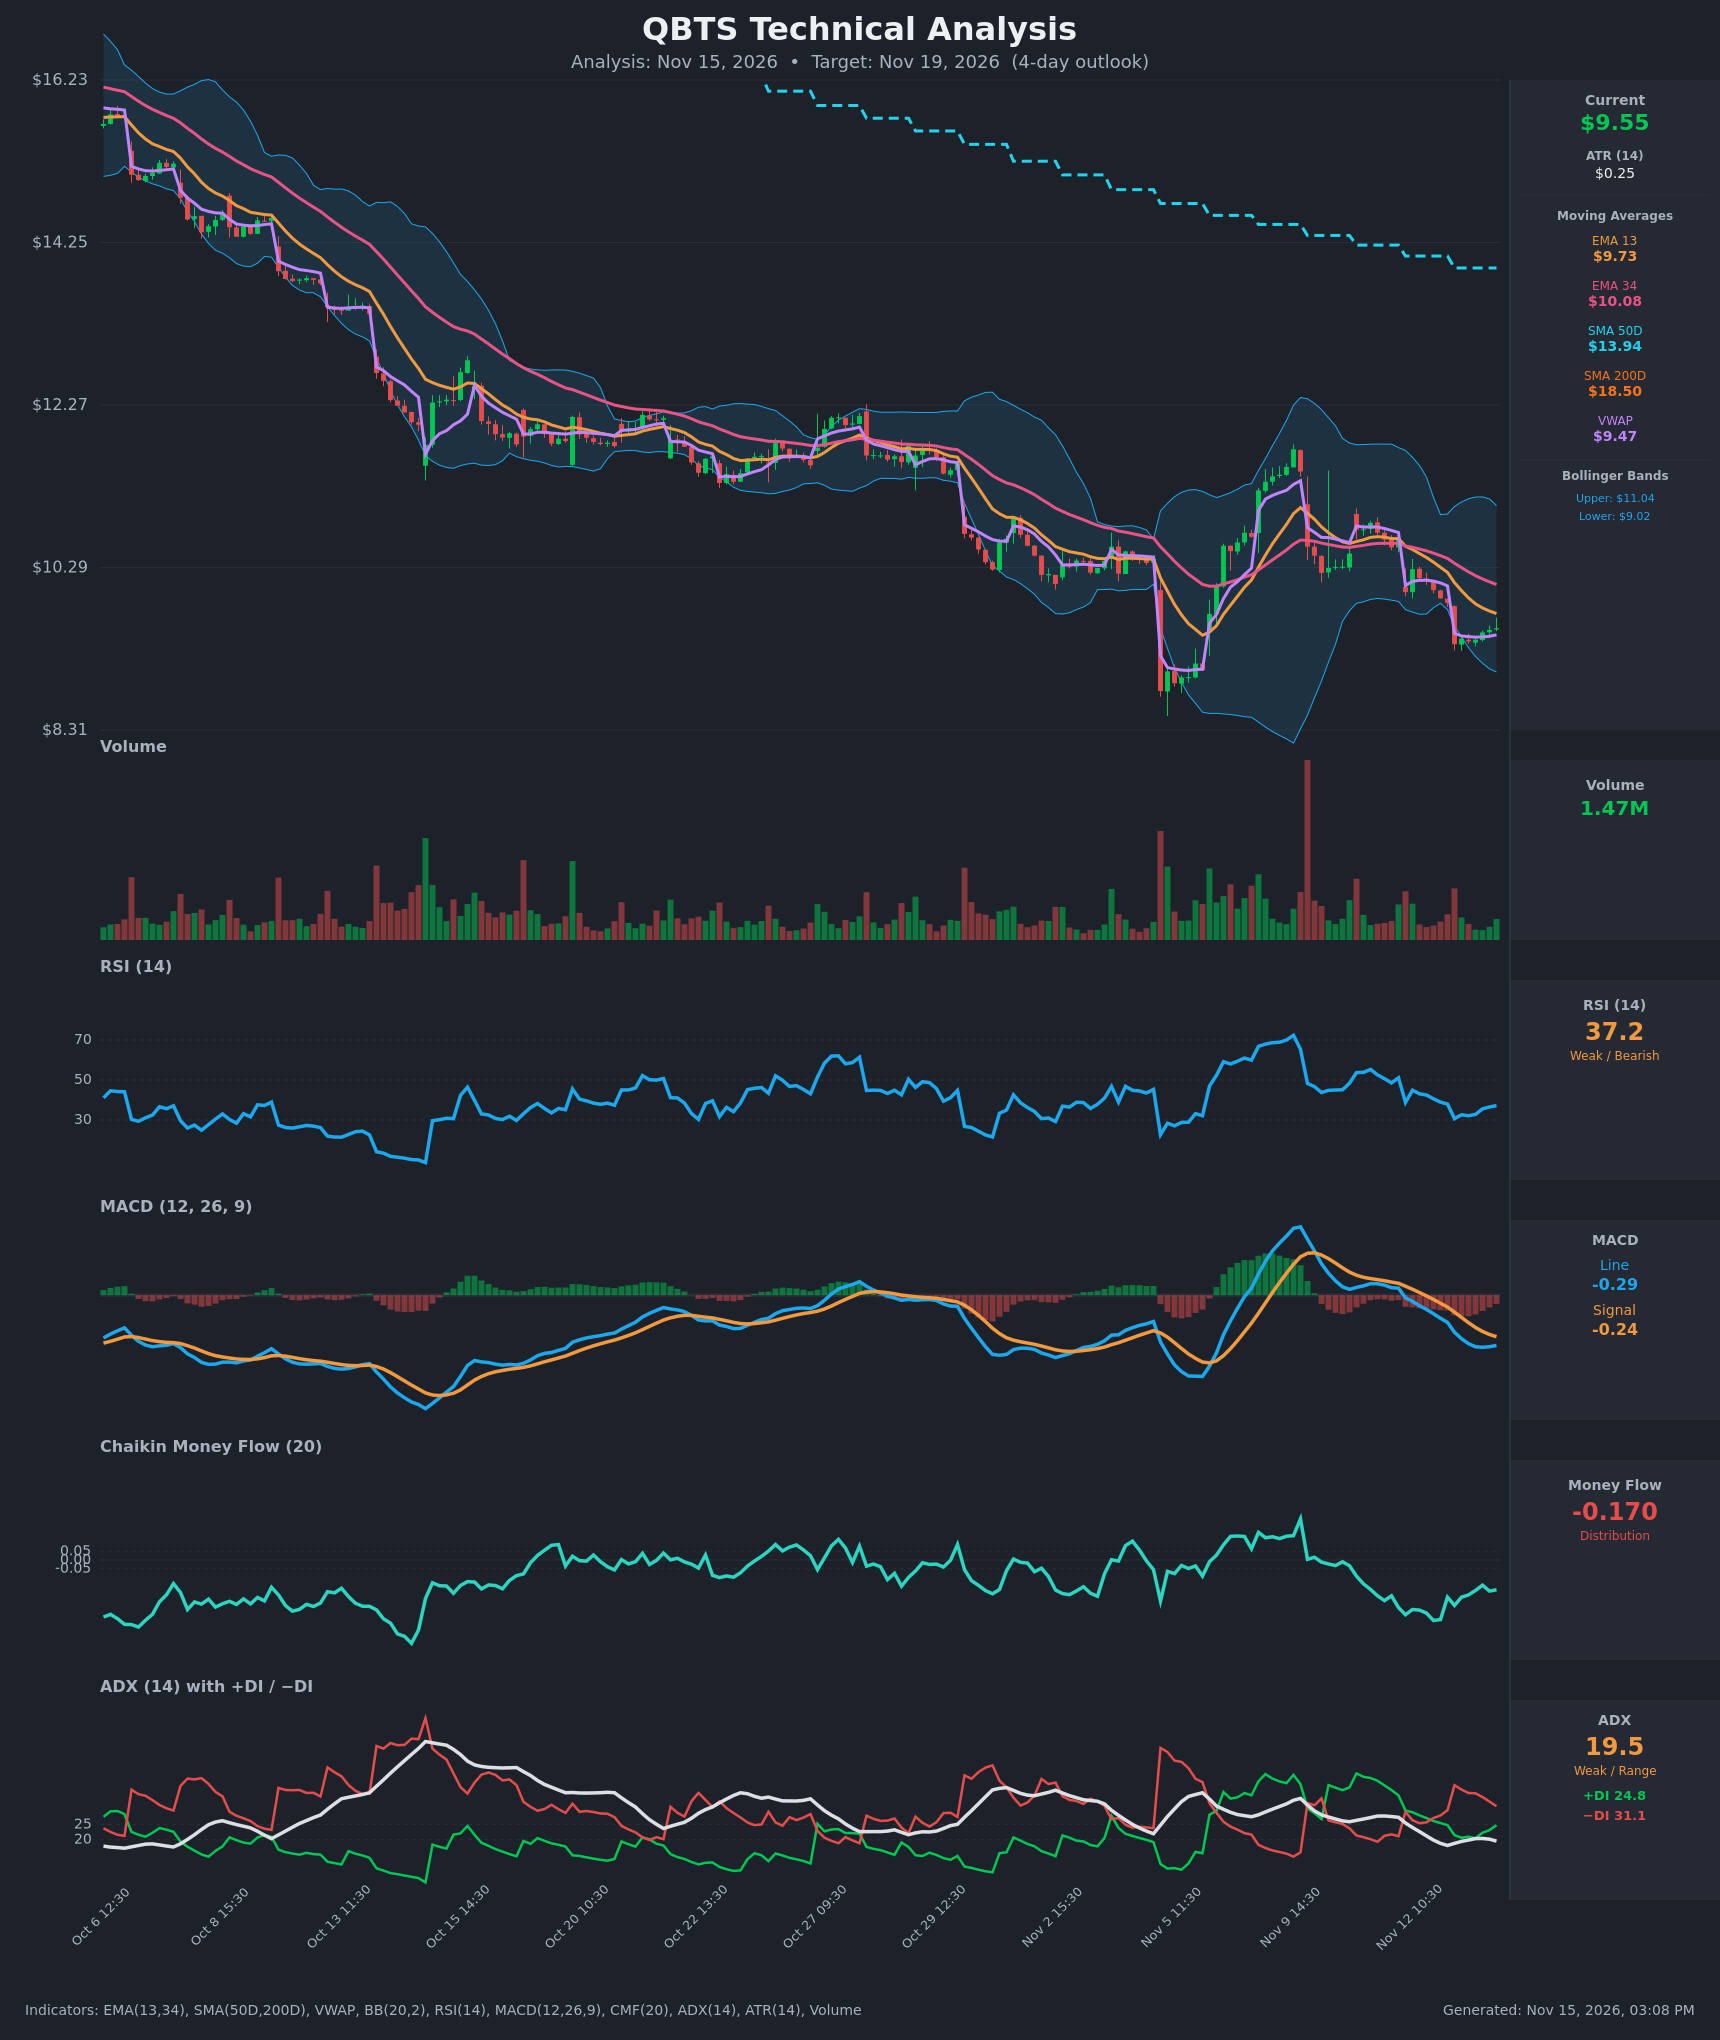
Analysis
TECHNICAL INDICATORS
- RSI (14): 37.18, below 50 and approaching oversold. It bounced from 30.7 on Nov 13 open but is still in bearish territory, with only a modest upturn. [Bearish]
- EMA 13 / EMA 34 (chart labels): EMA13 is $9.73 and EMA34 is $10.08. Price at $9.55 sits below both, and EMA13 is below EMA34, so they act as overhead resistance. The EMAs have been sloping down since Nov 11. [Bearish]
- MACD: The line is -0.287 and the signal is -0.237. The bearish crossover happened Nov 12 and the histogram is negative at about -0.05. The line did tick up slightly from its -0.298 low, so the histogram is narrowing, which hints at fading downside momentum. [Bearish]
- Bollinger Bands (20): Upper is $11.04 and lower is $9.02. Price is in the lower third of the bands, about $0.53 above the lower band, and the bands are wide after the recent volatility. This is a bearish position but not an extreme one, and a bounce toward the midline near $10.0 is possible. [Bearish]
- CMF (20): -0.170, well below -0.05. It has been negative for the full 15-bar window (-0.14 to -0.35) with a slight recovery from the -0.346 low, so selling pressure still dominates. [Distribution]
- ADX (14): 19.5 with −DI at 31.1 above +DI at 24.8. ADX is below 20, so the trend is weak, but the bears hold directional control. −DI has been on top since the Nov 12 afternoon, and the gap has narrowed from 38.0 vs 21.5. [Weak Trend + Bearish direction]
- Volume: 1.47M, light compared with the spikes seen on the Nov 5 and Nov 10 breakdown and reversal days. The last few bars show low-volume basing near $9.4-$9.55, which suggests selling is drying up but there is no buying conviction yet. [Neutral / Low-conviction]
- VWAP: $9.47, with price just above it at $9.55. This is a small intraday positive and acts as near-term support. [Neutral]
- SMA 50D / SMA 200D: $13.94 and $18.50. Price is far below both, and SMA50 is below SMA200 (a death cross already in place). This is a long-term downtrend. [Bearish]
DIVERGENCES & TRENDS
- Trend: The long-term downtrend is intact, with lower highs from $16+ down to about $9.5, and price is below the 50D and 200D SMAs.
- Divergence: No clear divergence. Price made new lows on Nov 13 (about $9.36) while RSI printed 30.7, and RSI has since turned up slightly, so there is early momentum stabilization but not a true bullish divergence.
- Crossovers: MACD crossed bearish on Nov 12. −DI crossed above +DI on Nov 12 afternoon. EMA13 is below EMA34 after trading around parity on Nov 12.
- Short-term behavior: Price has bounced from $9.36 to $9.55 in a tight range on the hourly chart, consolidating just above VWAP. This is a weak base inside a downtrend.
- Volatility: ATR of $0.25 per hour implies a typical move of about $0.50-$1.00 over 4 trading days.
CHART PATTERNS
- Bearish continuation structure: The decline from $16 shows a sequence of lower highs and lower lows, with failed rallies at the EMA34 (the Nov 9 spike to about $11.7 reversed fully). This resembles a descending channel, and the reference diagram's Bearish Flag/Pennant patterns point to continuation lower.
- Possible small base: The tight bounce above the Nov 5 low (about $8.8-$9.0) could form a small double-bottom-like base with the Nov 5 low, but it is unconfirmed without a break above about $10.3-$10.5.
- Targets: A break below $9.36 opens the Nov 5 low zone around $8.8-$9.0. Upside is capped by EMA13/EMA34 at $9.73/$10.08.
POTENTIAL SCENARIOS
- Scenario 1: Bearish Continuation Lower — Price fails at EMA13 ($9.73) and breaks the Nov 13 low, with MACD, CMF, and −DI all supporting sellers. Trigger: hourly close below $9.36. Target: $8.95-$9.10 (lower Bollinger Band area). Invalidation: close above $10.08 (EMA34). (50% probability)
- Scenario 2: Neutral Consolidation — Price chops between VWAP support and EMA13 resistance as the weak ADX (below 20) keeps the move sideways. Trigger: holding $9.36-$9.80. Target: $9.40-$9.80. Invalidation: break outside $9.30 or $10.10. (25% probability)
- Scenario 3: Bullish Oversold Bounce — RSI near 30 and the narrowing MACD histogram trigger a relief rally toward the EMA34 and Bollinger midline. Trigger: close above $9.73 with rising volume. Target: $10.05-$10.30. Invalidation: close below $9.36. (25% probability)
PRICE TARGETS
- Target Price: $9.25 (4-day timeframe; about -3.1% from current)
- Expected Range: $8.85 to $9.80 (width $0.95, about 9.9% of current price, scaled for a 4-day horizon on a high-volatility name where ATR is $0.25 per hour)
- Key Levels: Support at $9.02 (lower Bollinger Band), Resistance at $9.73 (EMA13)
OVERALL BIAS
OVERALL BIAS: BEARISH - Price is below all key moving averages with a bearish MACD crossover, −DI above +DI, and persistent CMF distribution (-0.17), and the long-term death-cross structure is intact. The weak ADX and the modest RSI turn limit conviction, so I expect a drift toward the $9.0-$9.25 area.
This is educational analysis and not financial advice.