HOOD 6-day bearish forecast — Nov 15, 2026
- Bias: Bearish
- Timeframe: 6 days (made Nov 15, 2026, target date Nov 20, 2026)
- Price at analysis: $77.87
- Price target: $76.30
- Expected range: $73.30 – $79.90
- Result: Pending — graded after the close on Nov 20, 2026
Get a free AI analysis of HOOD today
Analysis
TECHNICAL INDICATORS
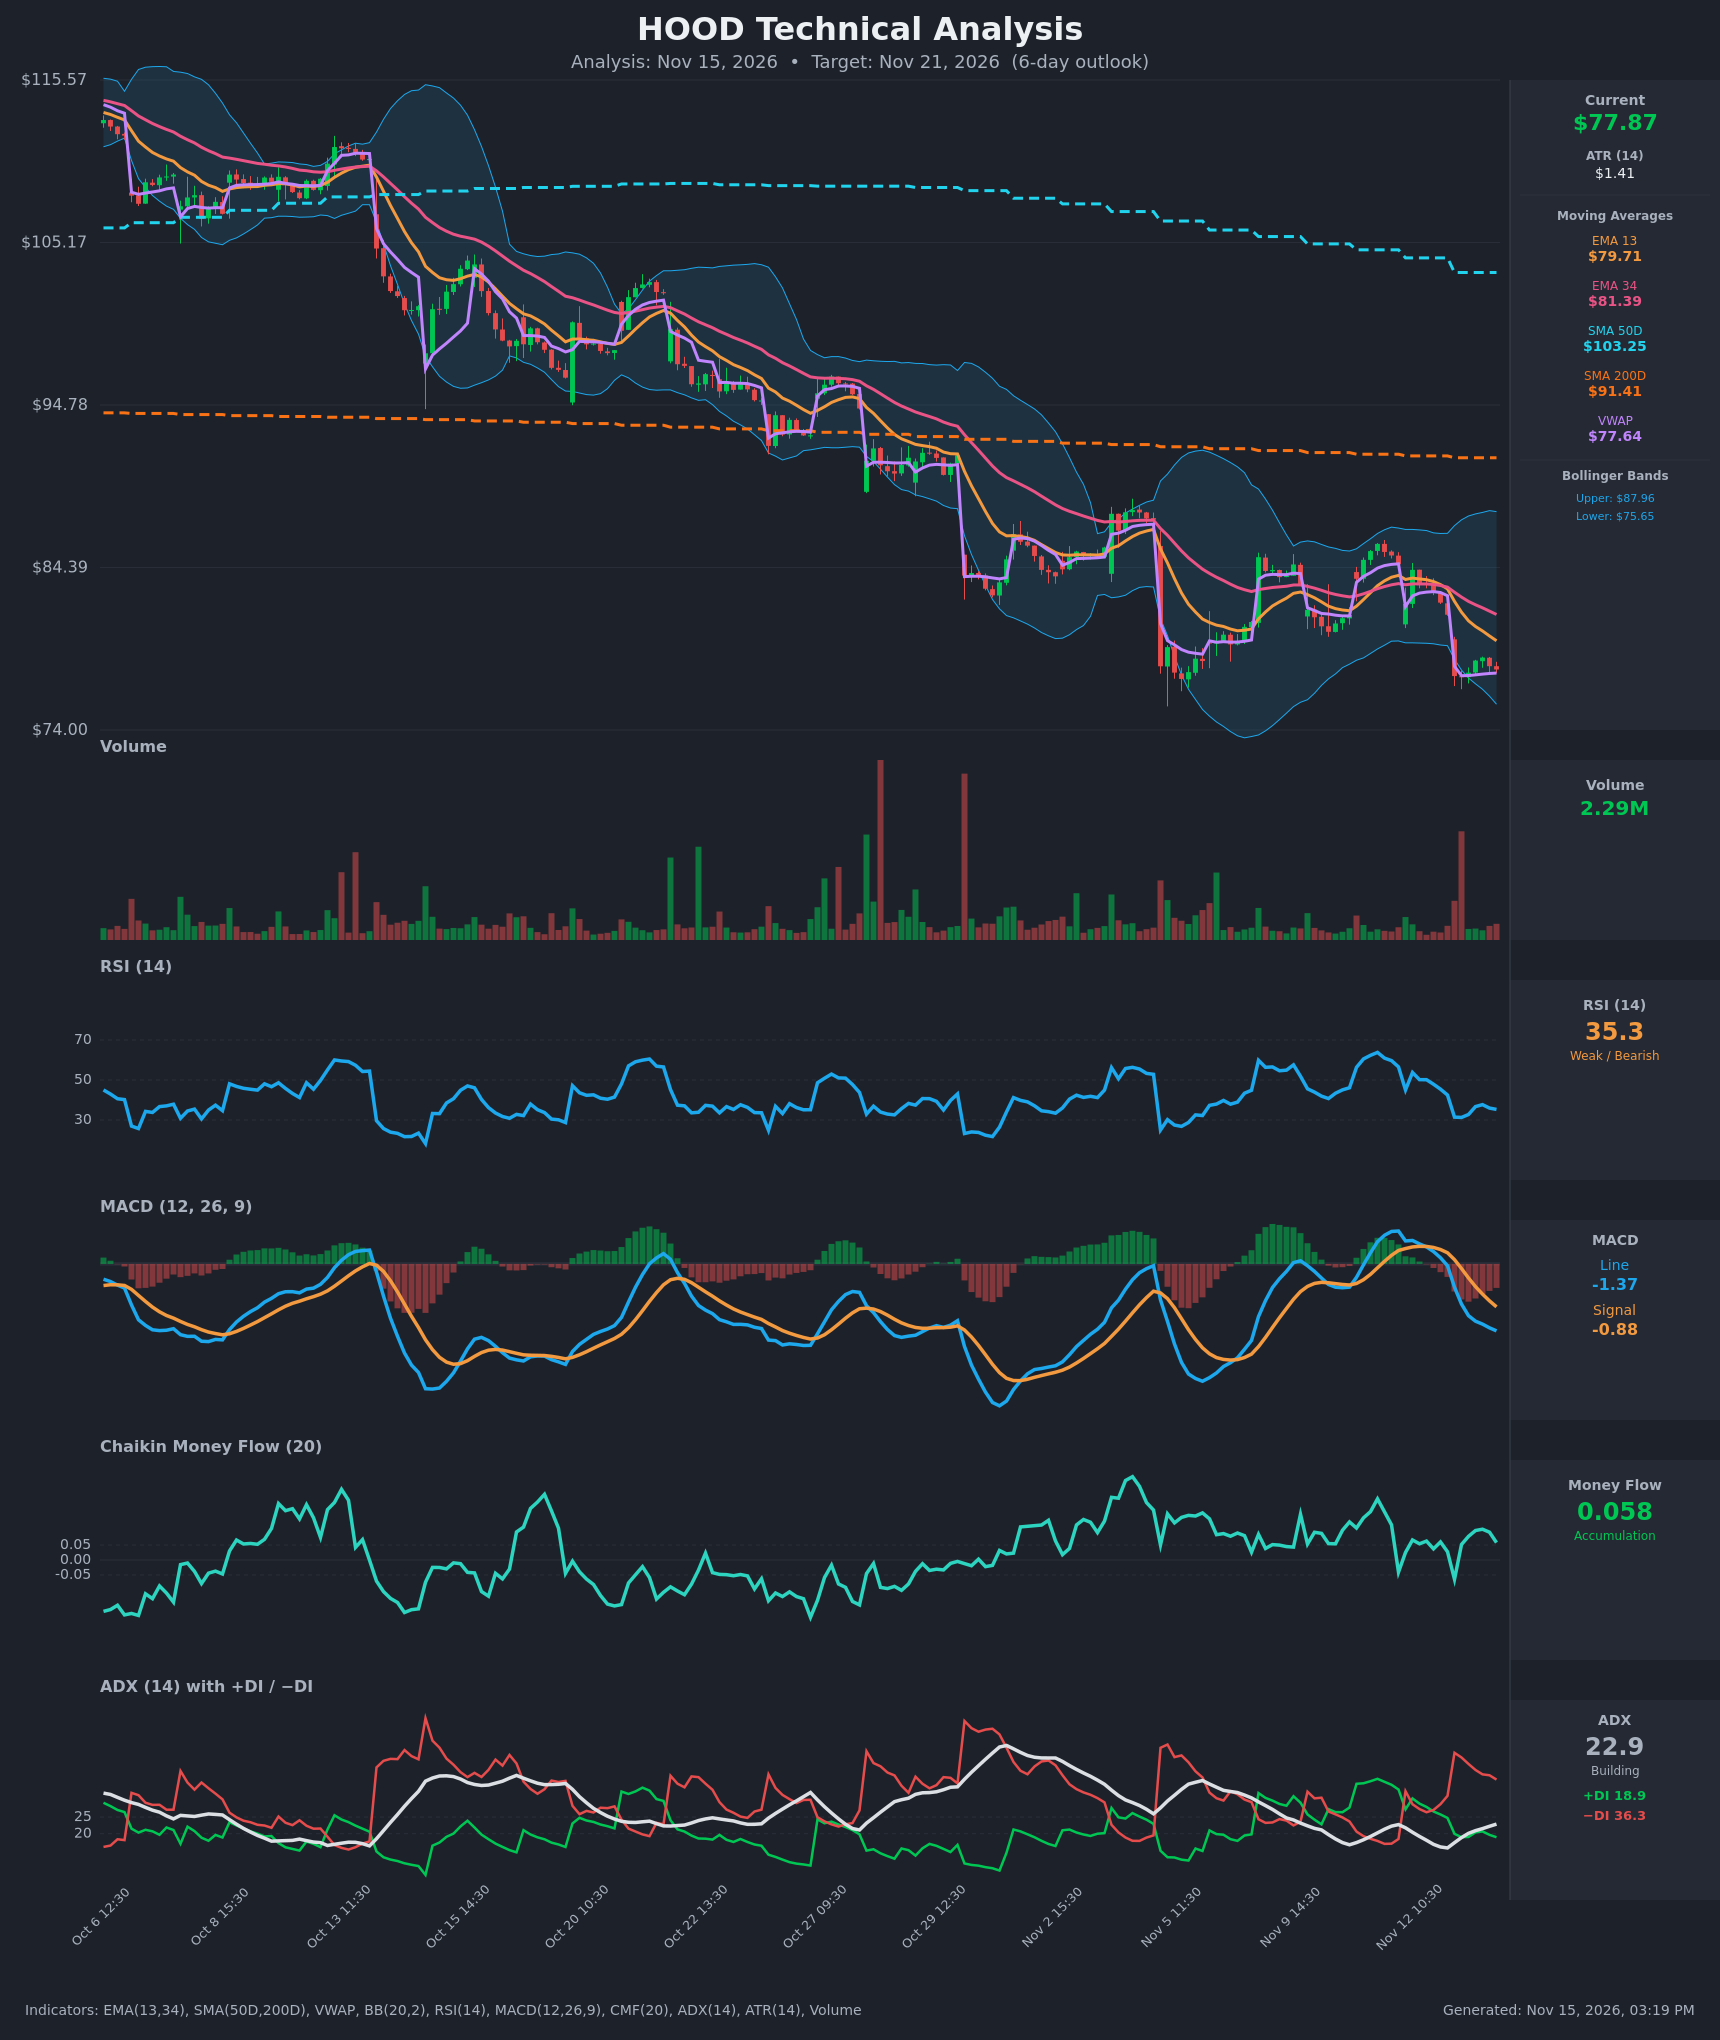
- RSI (14): 35.30, down from ~50 on Nov 12 and a low of 31.3 on Nov 13 morning. It sits just above oversold with no bullish divergence. Momentum is weak but not yet washed out. [Bearish]
- 20 EMA: The chart shows EMA 13 at $79.71 and EMA 34 at $81.39. Price at $77.87 is below both, and EMA13 is below EMA34 and falling, so both act as overhead resistance. [Bearish]
- MACD: Line -1.37 is below signal -0.88 after a bearish cross on Nov 13 at 09:30. The histogram is negative and widening, so downside momentum is still building. [Bearish]
- Bollinger Bands (20): Upper $87.96, lower $75.65. Price at $77.87 is in the lower quarter of the bands, about $2.2 above the lower band. The bands are fairly wide and the stock is walking down the lower half. A tag of the lower band is plausible, which could also trigger a bounce. [Bearish]
- CMF (20): 0.058, just above the +0.05 threshold. It has stayed mildly positive for weeks even as price fell, so buyers are absorbing some of the selling. This is the one constructive signal, but it is marginal. [Accumulation]
- ADX (14): 22.9 and rising, with −DI 36.3 far above +DI 18.9. The trend is building and the bears control it. [Moderate Trend, Bearish]
- Volume: 2.29M on the latest bar, which is average to light. The heavy-volume spike on Nov 13 was a red, down bar, so selling carried conviction on the breakdown. The bounce since has come on light volume. [Bearish, weak bounce]
Other context:
- VWAP: $77.64, with price just above it. This is the only nearby support and a slight intraday positive.
- SMAs: SMA50D at $103.25 is far above SMA200D at $91.41, so there is no death cross yet, but both are well above price. Price is far below SMA200D, confirming a long-term downtrend.
DIVERGENCES & TRENDS
- Price is making lower highs and lower lows from ~$115 to $77.87. It is a persistent, stair-step downtrend.
- CMF is mildly positive and rising against falling price. This is a mild bullish divergence, but it has persisted for weeks without producing a reversal, so it is low reliability.
- RSI has not yet printed a lower low than prior oversold readings (~25-30 earlier), so there is no clear bullish divergence.
- Bearish MACD cross on Nov 13 and −DI dominance (36.3 vs 18.9) confirm downside momentum. ADX is climbing from 15.7 to 22.9, so trend strength is increasing.
- EMA13 crossed below EMA34 on Nov 12 afternoon, a short-term bearish crossover.
- The Nov 13 open gapped from $81.37 to $77.45 (~4.8%), a breakdown gap below the Nov 5-12 consolidation range of ~$80-85.
CHART PATTERNS
- The broad structure is a descending channel / bearish continuation. Lower highs and lower lows persist, with the Nov 6-12 consolidation (~$80-85) acting like a Bearish Flag/Rectangle that broke down on the gap.
- Measured move: the flag range of ~$5 projected from the ~$80 breakdown suggests ~$75, near the lower Bollinger Band at $75.65.
- Price is now consolidating just above the gap low, forming a small base around $77-79. A failed bounce under $79.7-81.4 (EMAs) would keep the Bearish Flag target in play.
- A bullish reversal pattern (double bottom) is not confirmed. A bounce would need to reclaim $81.4.
POTENTIAL SCENARIOS
- Scenario 1: Bearish Continuation Lower — The breakdown gap holds and rallies fail at the EMA13 (~$79.7). −DI dominance and a widening negative MACD histogram drive a test of the lower Bollinger Band and beyond. Trigger: break below $77.00 / VWAP ($77.64). Target: $74.50-$75.50. Invalidation: close above $81.40 (EMA34). (50% probability)
- Scenario 2: Neutral Oversold Consolidation — RSI near 35 and mildly positive CMF hold price in a $76-80 base while the MACD histogram flattens. Trigger: holds $76.50 with light volume. Target: $77-79. Invalidation: break below $76.00 or above $80.50. (22% probability)
- Scenario 3: Bullish Relief Bounce — Oversold conditions and CMF accumulation spark a short-covering bounce to the EMAs, then resistance. Trigger: reclaim of $79.70 on rising volume. Target: $80.50-$81.40. Invalidation: loss of $76.50. (28% probability)
PRICE TARGETS
Timeframe: 6 days (7-10 day guidance, ~4-8% width; ATR $1.41 implies a ~$3.5 typical 6-day move).
- Target Price: $76.30
- Expected Range: $73.30 to $79.90 (width $6.60 = ~8.5% of current price; slightly wide, reflecting volatile conditions and gap risk)
- Key Levels: Support at $75.65 (lower Bollinger Band), Resistance at $79.71 (EMA13)
OVERALL BIAS
OVERALL BIAS: BEARISH - Price is below all key moving averages, with a fresh bearish MACD cross, −DI (36.3) far above +DI (18.9), ADX rising, and a breakdown gap below the prior range. Only the marginal CMF reading and near-oversold RSI argue for a bounce, which would likely stall at the $79.7-$81.4 EMAs.
This is educational analysis and not financial advice.