HOOD 4-day bearish forecast — Nov 15, 2026
- Bias: Bearish
- Timeframe: 4 days (made Nov 15, 2026, target date Nov 18, 2026)
- Price at analysis: $77.87
- Price target: $76.70
- Expected range: $75.90 – $79.70
- Result: Pending — graded after the close on Nov 18, 2026
Get a free AI analysis of HOOD today
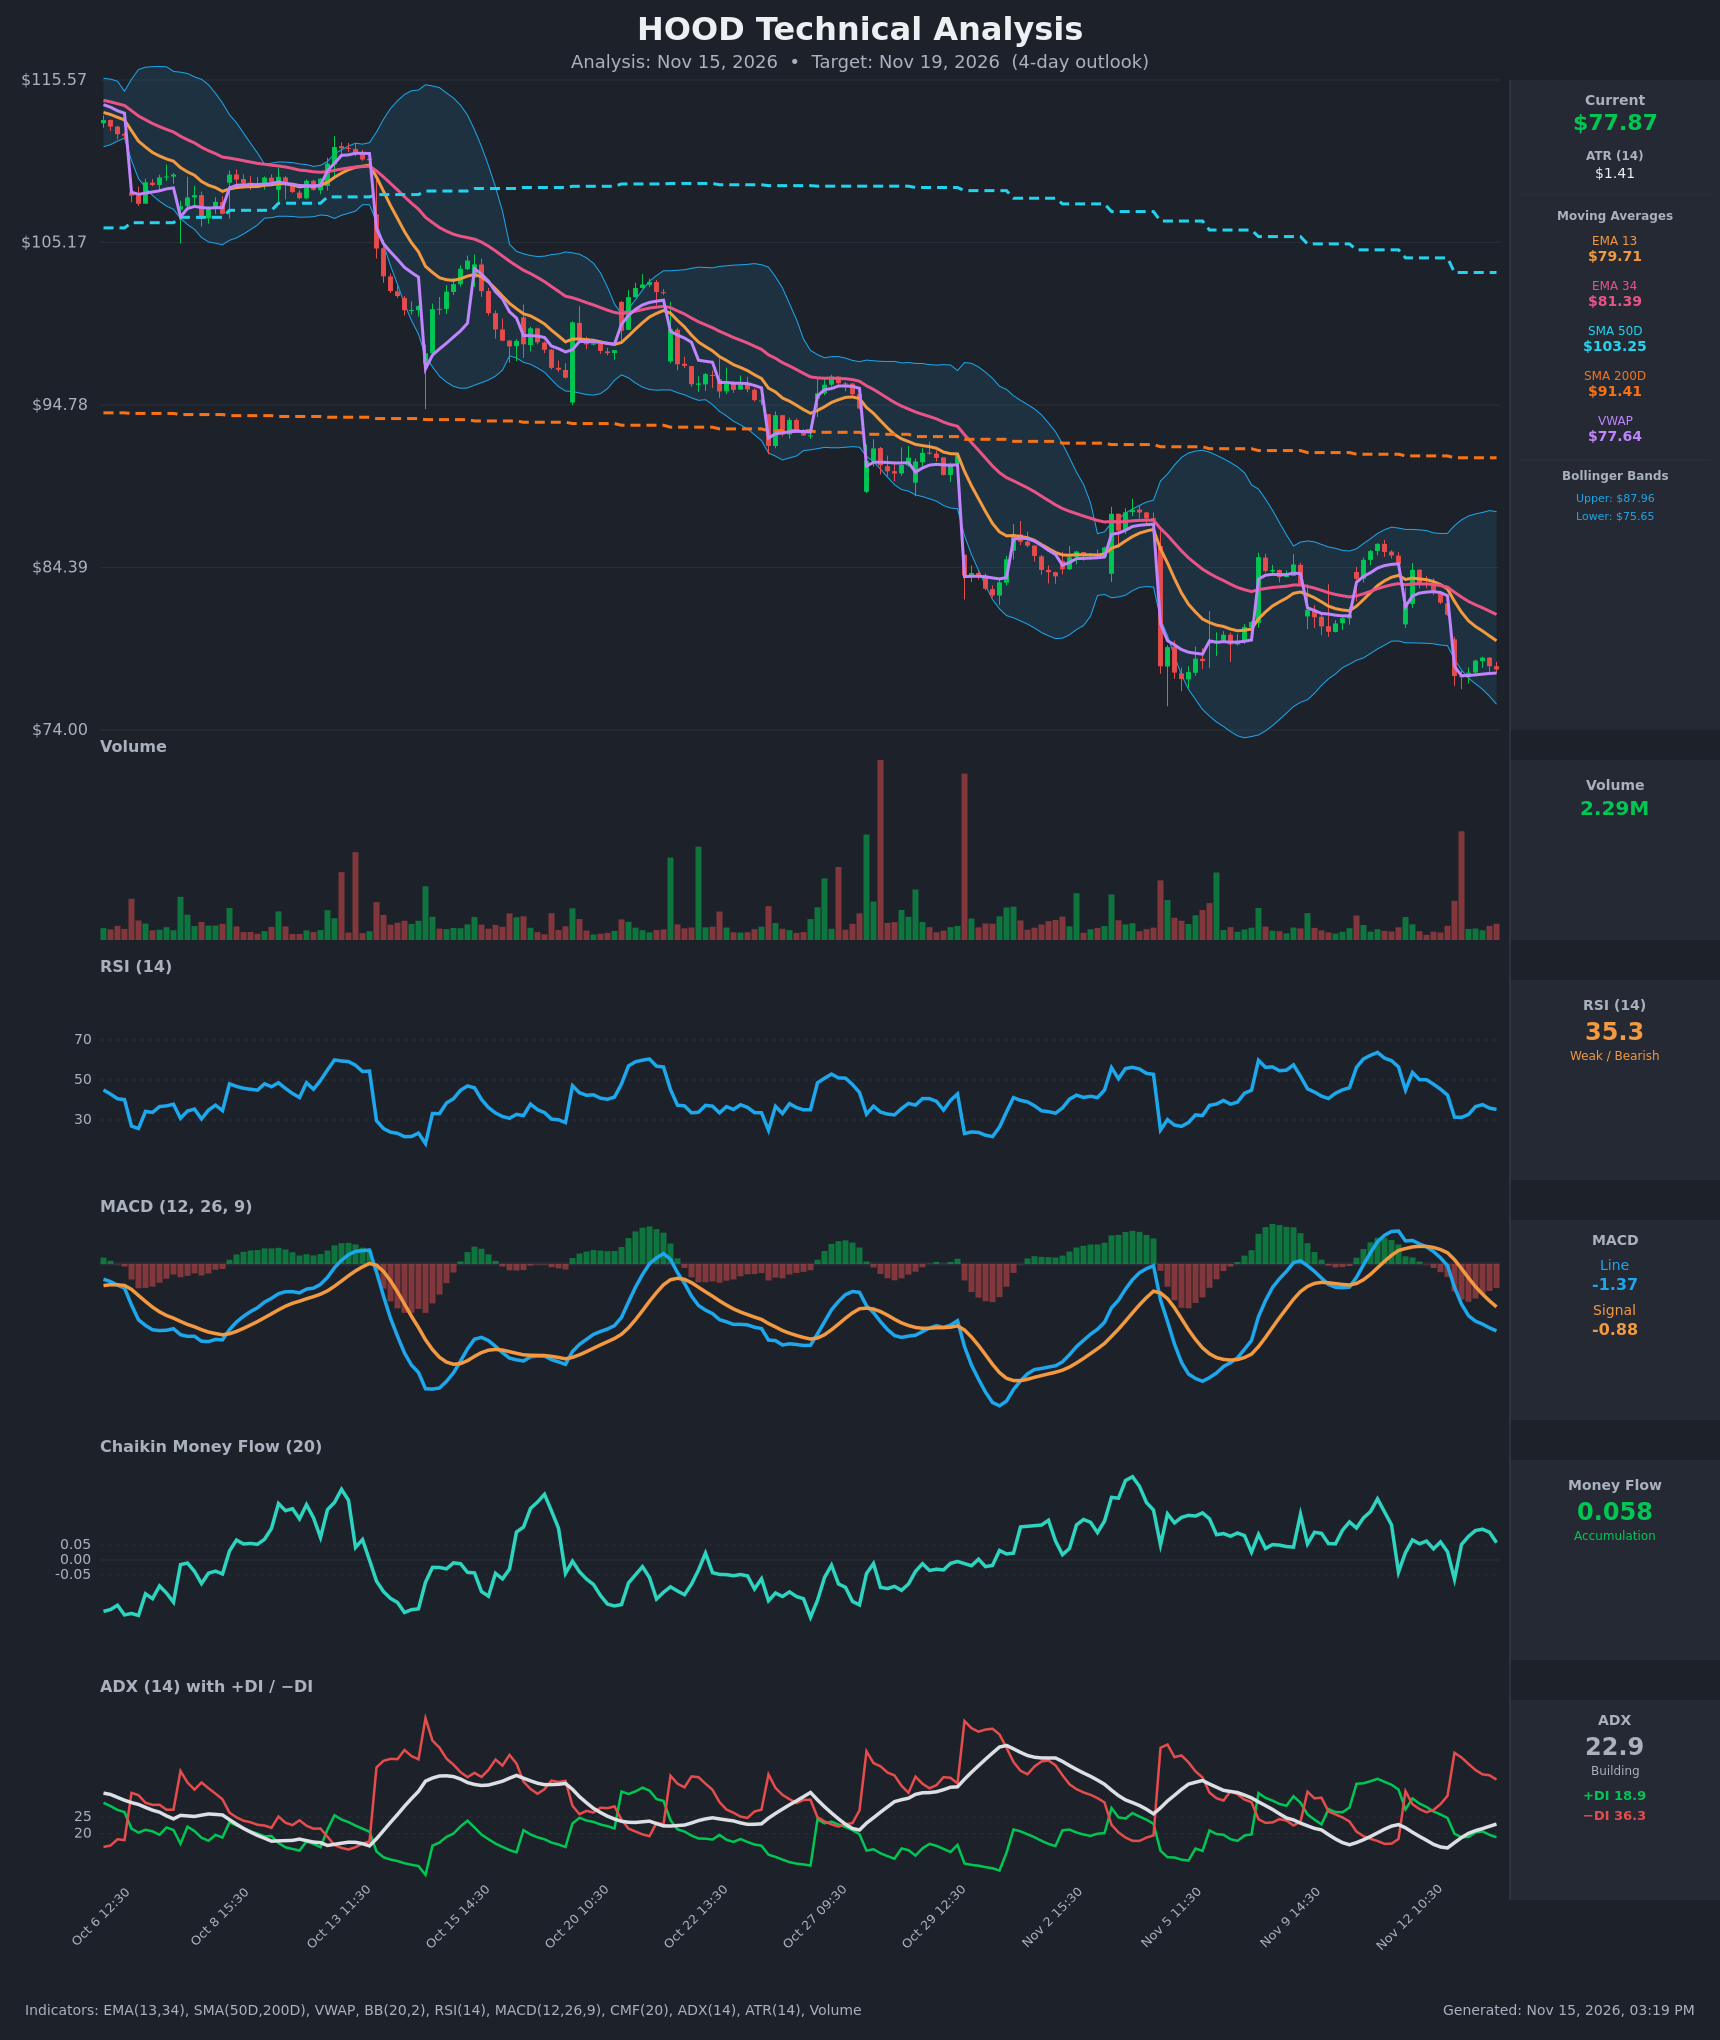
Analysis
TECHNICAL INDICATORS
- RSI (14): 35.30. It is near oversold but not there yet, and it has been falling from the 50s earlier this week. It bounced slightly off 31 but is rolling over again. Momentum is bearish with room to push lower. [Bearish]
- 20 EMA: The feed gives EMA 13 at $79.71 and EMA 34 at $81.39. Price at $77.87 is below both, and both are sloping down. EMA13 crossed below EMA34 on Nov 12 afternoon, so the short-term moving averages are overhead resistance. [Bearish]
- MACD: Line -1.37 is below signal -0.88, and the gap is widening. Both are negative. The bearish crossover came on Nov 12 and the histogram is expanding negative. [Bearish]
- Bollinger Bands (20): Upper $87.96, lower $75.65, so price sits in the lower quarter of the bands. The bands are wide after the volatile drop, and price is walking the lower half. It is not yet a squeeze or a clear band-riding breakdown, but only about $2.20 separates price from the lower band. [Bearish]
- CMF (20): 0.058, just above the +0.05 threshold. Money flow has stayed mildly positive despite the decline, which hints at some dip buying. It is marginal and has been flattening, so it does not offset the trend damage. [Accumulation]
- ADX (14): 22.9 and rising from the mid-teens. −DI at 36.3 is far above +DI at 18.9. Trend strength is building just under the 25 threshold, with bears firmly in control. [Moderate/Building Trend – Bearish]
- Volume: 2.29M on the latest bar, which is light. The heavy volume came on the Nov 13 gap-down open. The bounce attempts since then are on thin volume, so buyers lack conviction. [Bearish – weak bounce participation]
DIVERGENCES & TRENDS
- Mild CMF divergence: CMF has held positive (about 0.05–0.10) while price made lower lows. This is a possible sign of absorption, but it has not yet been confirmed by RSI or MACD.
- No bullish RSI/MACD divergence: RSI is around 35, above its prior 25–30 lows, but that was at higher prices, so it is not a reversal signal.
- Trend structure: Price has made a persistent series of lower highs and lower lows since mid-October, with step-down gaps (Oct 29, Nov 5, Nov 13). Each rally has failed under the EMA13/EMA34 cluster.
- Crossovers:
- EMA13 crossed below EMA34 (bearish).
- MACD crossed below signal (bearish).
- −DI crossed above +DI and the gap is widening (bearish).
- Long-term trend:
- Price is below the SMA200D ($91.41) and the SMA50D ($103.25).
- The SMA50D is falling toward the SMA200D, so a death cross is plausible in the coming weeks.
- VWAP: Price is just above VWAP ($77.64). This level is acting as the immediate pivot after the gap-down.
CHART PATTERNS
- Descending channel / bearish continuation: The broader move is a clean downtrend with lower highs. This is the main structure.
- Bearish flag/rectangle breakdown (reference: Bearish Flag/Pennant): Price consolidated roughly $82–$85 from Nov 5 to Nov 12, then broke down with a gap on Nov 13. The measured move of about $3–$4 points to the $77–$78 zone, which has largely been achieved already.
- Current coil: The tight range at $77–$78.6 after the gap is a small bearish pennant/flag. A break below $77.40 would target the lower Bollinger Band at $75.65 and then the $74 area.
- Counter-pattern: A snap-back toward the EMA13 (about $79.7) is possible if CMF accumulation proves real. That would be a retest of broken support and not a bullish reversal pattern.
POTENTIAL SCENARIOS
- Scenario 1: Bearish Continuation Lower — Price holds under the EMA13 and VWAP, then breaks the post-gap low. Sellers remain in control with −DI dominant and MACD expanding negative. Trigger: hourly close below $77.30. Target: $75.65–$76.50 (lower Bollinger Band area). Invalidation: close above $79.70 (EMA13). (50% probability)
- Scenario 2: Bullish Relief Bounce — Mildly positive CMF and a near-oversold RSI spark a mean-reversion bounce toward the declining EMAs. Trigger: reclaim of $78.60 on rising volume. Target: $79.70–$80.50 (EMA13, then the gap fill zone). Invalidation: rejection at EMA13 and a close back below $77.40. (30% probability)
- Scenario 3: Neutral Chop — Price stays pinned around VWAP between the post-gap low and the EMA13 while ADX consolidates. Trigger: no break of $77.30 or $79.00. Target: $77.00–$79.00. Invalidation: any decisive close outside that band. (20% probability)
PRICE TARGETS
For the 4-day timeframe, the Expected Range width is $3.80, or about 4.9% of the current price. That sits within the guidance for a short horizon of this length.
- Target Price: $76.70 (Nov 19, 2026)
- Expected Range: $75.90 to $79.70
- Key Levels: Support at $75.65, Resistance at $79.71
OVERALL BIAS
OVERALL BIAS: BEARISH - Price is below all key moving averages, with MACD and −DI both bearish and ADX building. Rallies are failing on light volume under the EMA13. Marginally positive CMF and an RSI near 35 argue for a bounce risk, so conviction is modest, with a drift toward the $75.65 lower Bollinger Band as the base case.
This is educational analysis and not financial advice.