SMH 4-day bearish forecast — Nov 15, 2026
- Bias: Bearish
- Timeframe: 4 days (made Nov 15, 2026, target date Nov 18, 2026)
- Price at analysis: $486.60
- Price target: $482.00
- Expected range: $474.00 – $497.00
- Result: Pending — graded after the close on Nov 18, 2026
Get a free AI analysis of SMH today
Analysis
TECHNICAL INDICATORS
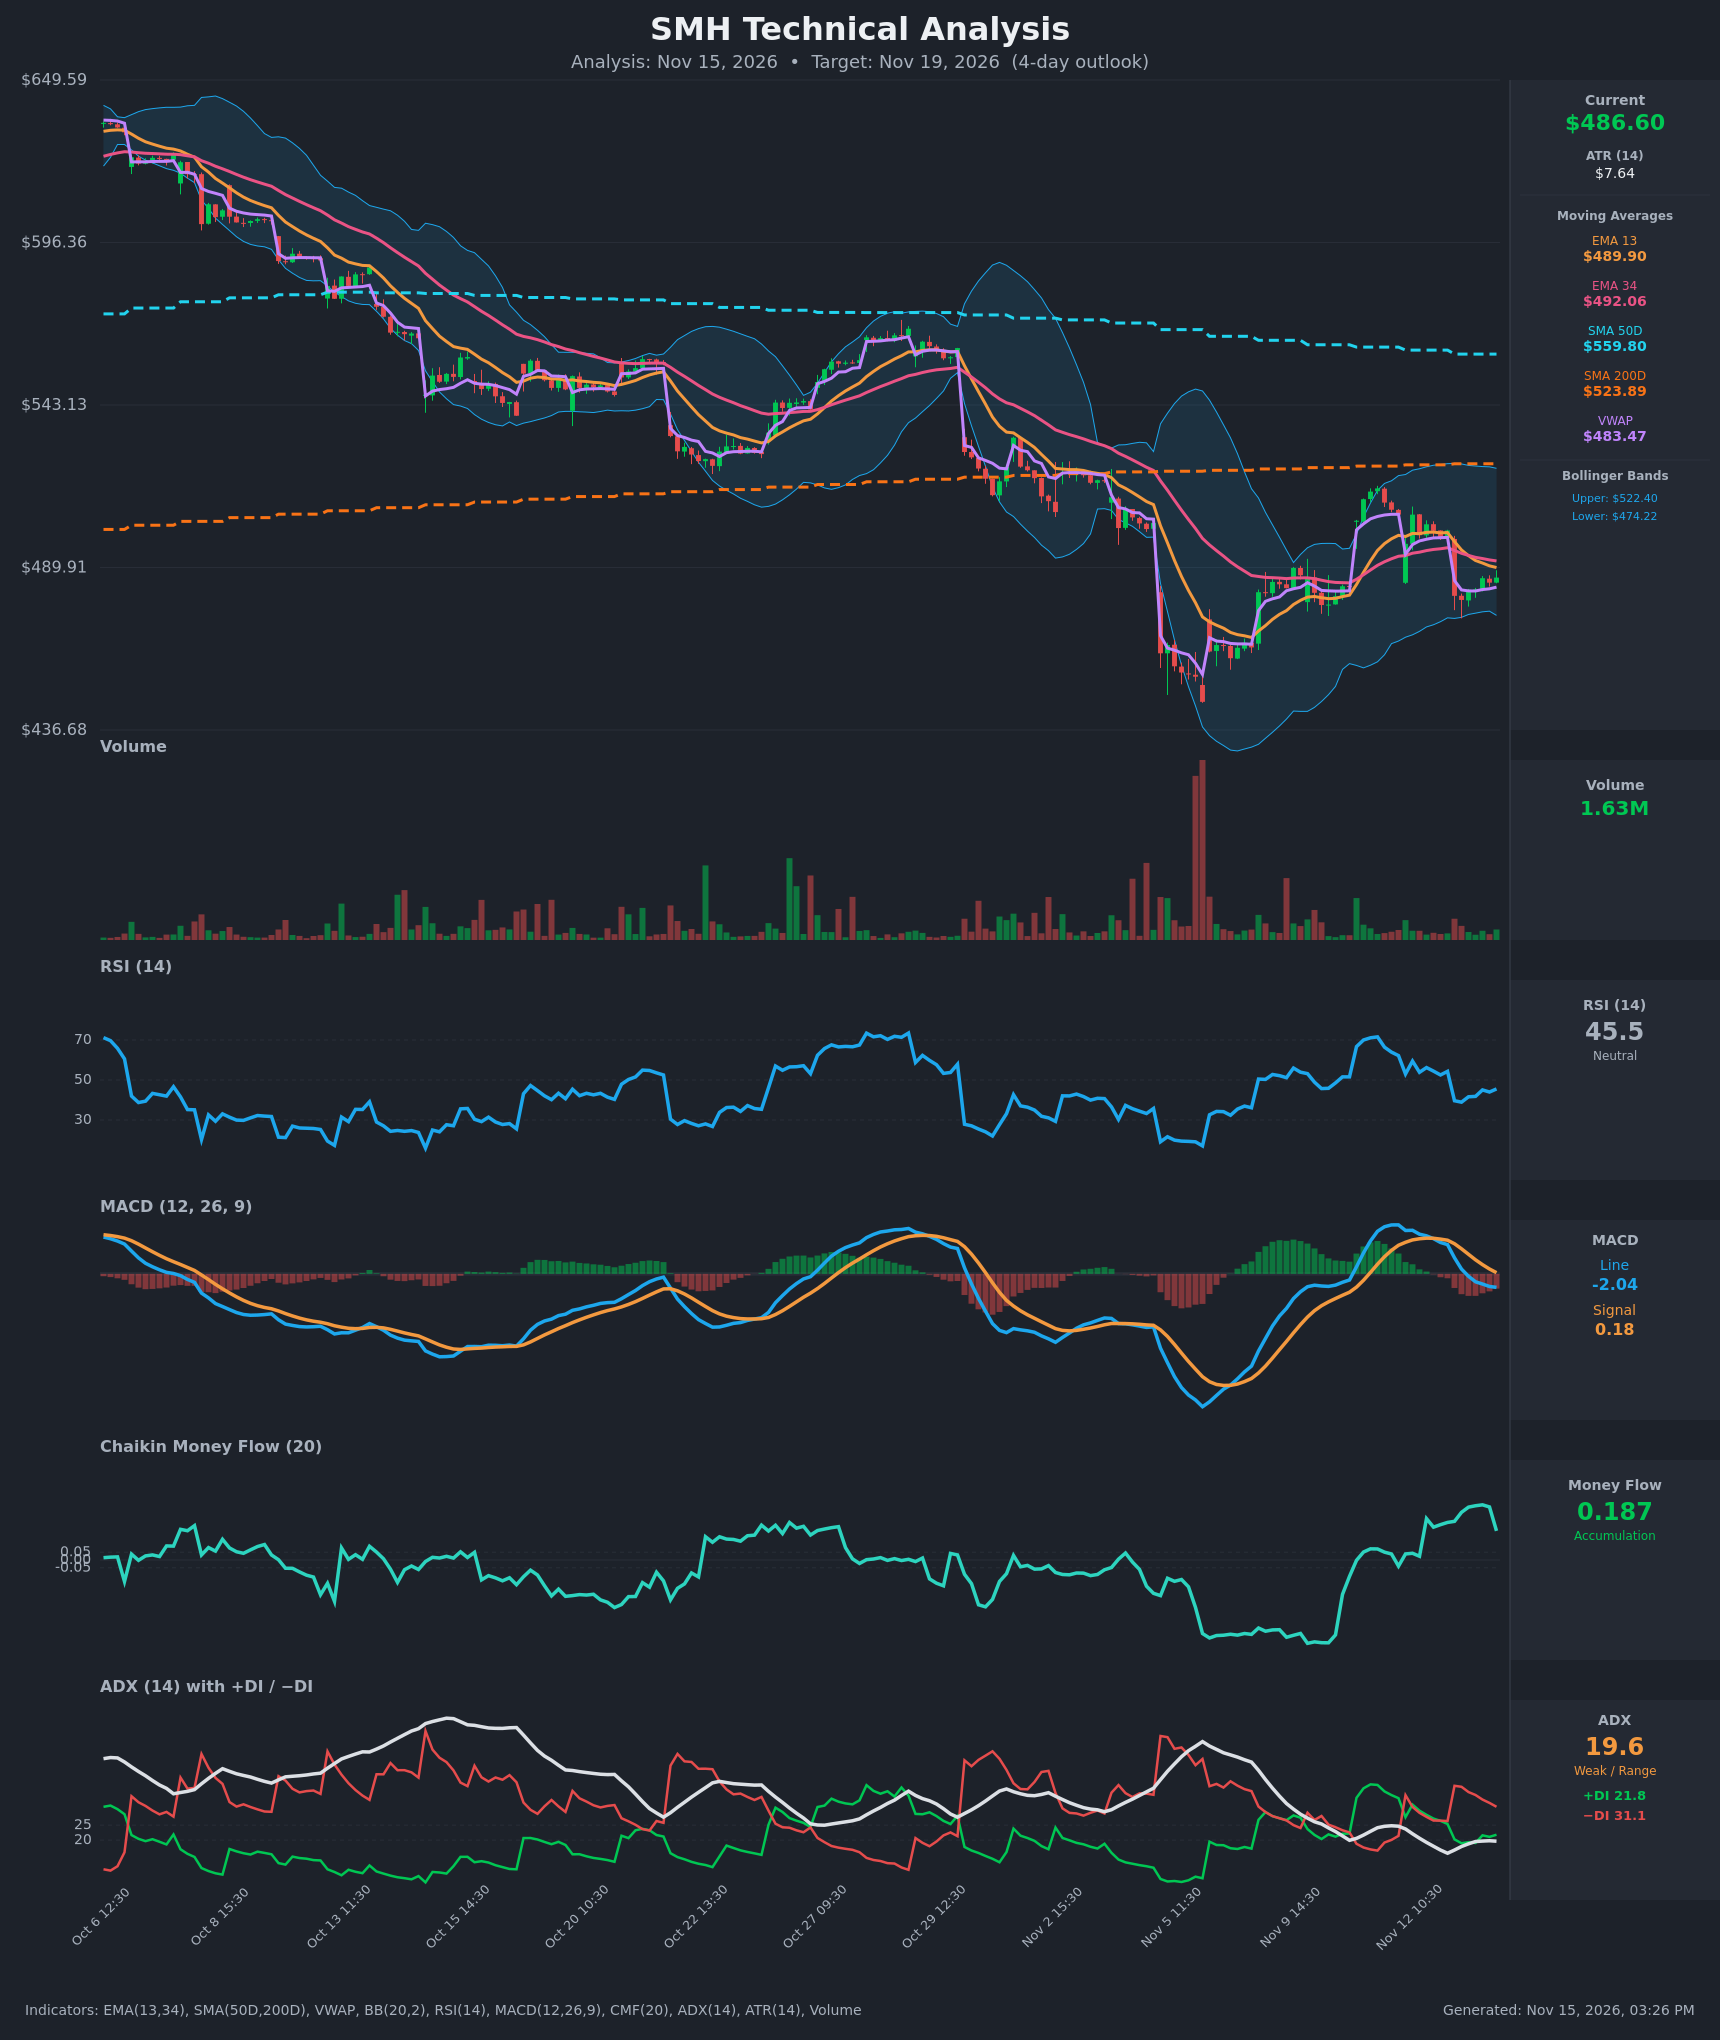
- RSI (14): 45.5, below the 50 midline. It fell from the 50s to the 30s on the Nov 13 gap down and has recovered only slightly (39 to 45). It is not oversold, so there is room to fall, but the bounce is mild. [Neutral]
- 20 EMA: The chart shows EMA 13 at $489.90 and EMA 34 at $492.06. Price at $486.60 is below both, and EMA13 crossed below EMA34 on Nov 13. Both averages are sloping down, so they act as overhead resistance at about $490-$492. [Bearish]
- MACD: The line is at -2.04 and the signal at +0.18. A bearish crossover occurred on Nov 13 around 11:30, and the histogram is negative and widening. Momentum is rolling over, though the zero line is still close. [Bearish]
- Bollinger Bands (20): The upper band is $522.40 and the lower band $474.22. Price at $486.60 is in the lower-middle part of the bands, about 26% of the way up from the lower band. The bands are fairly wide after the Nov 5 flush. The midline is near $498, so the path of least resistance is a drift toward the lower band unless price reclaims it. [Neutral]
- CMF (20): 0.187, well above +0.05. It has been positive since Nov 6 but pulled back from about 0.35 on Nov 13. This is accumulation, but it is fading on the latest drop. [Accumulation]
- ADX (14): 19.6 with +DI 21.8 and −DI 31.1. The trend is weak and range-bound, but −DI is clearly on top after the Nov 13 gap down, so sellers have the edge directionally. [Weak Trend, bearish lean]
- Volume: 1.63M, below the large spike on Nov 5. Recent volume is modest, and the gap-down bar on Nov 13 was not accompanied by capitulation-level volume. That points to a controlled pullback, not panic. [Neutral]
DIVERGENCES & TRENDS
- Price is in a long-term downtrend. It is below SMA50D ($559.80), which is falling, and below SMA200D ($523.89). SMA50D is above SMA200D, but the gap has been narrowing, so a death cross is a possibility over coming weeks.
- CMF is positive (accumulation) while price, MACD and DI are bearish. This is a mild bullish divergence, but CMF is rolling over from its peak.
- Price made a lower high on Nov 12-13 (about $507) versus Nov 5-6. It is holding above the Nov 5 low of about $455-$460, and the structure looks like a bounce within a larger downtrend.
- The bearish MACD crossover and EMA13/EMA34 cross occurred on Nov 13.
- Price is above VWAP ($483.47) by about $3. That holds a thin bullish tilt intraday, but a break below VWAP would confirm the sellers.
- ADX is under 20 and falling, so there is no strong trend, which is consistent with range trading between about $474 and $492.
CHART PATTERNS
- There is a Bearish Rising Wedge or Bearish Flag Pattern (continuation) forming. The bounce from the Nov 5-6 low to about $507 was a counter-trend rally that has now been rejected and gapped down, consistent with a failed recovery.
- Alternatively, there is a loose range between the lower Bollinger Band (~$474) and the EMA cluster (~$490-$492), so a symmetrical-triangle-type consolidation is possible.
- The pattern read is that a rejection from the 200-day SMA zone (about $524) and the gap down favor a retest of $474-$480. A break below $474 would target the $455-$460 Nov 5 lows.
POTENTIAL SCENARIOS
- Scenario 1: Bearish Drift to Lower Band — price stays below the falling EMA13/34 cluster, with −DI dominant and MACD negative, and tests the lower Bollinger Band. Trigger: rejection at $490-$492 and a break below VWAP ($483.47). Target: $474-$478. Invalidation: close above $493 on rising volume. (50% probability)
- Scenario 2: Neutral Range Chop — ADX is below 20 and CMF stays positive, so price oscillates between about $478 and $492 around VWAP. Trigger: holds VWAP with no clear break. Target: $483-$490. Invalidation: break of $474 or $494. (30% probability)
- Scenario 3: Bullish Relief Bounce — CMF accumulation supports a reclaim of the EMAs and a move toward the Bollinger midline. Trigger: close above $492 with expanding volume. Target: $498-$503. Invalidation: loss of $480. (20% probability)
PRICE TARGETS
For a 4-day horizon, I use a range width of about 4-6% of current price, or roughly $22-$28. ATR of $7.64 supports a typical 4-day move of about ±$15. The Expected Range of $474.00 to $497.00 is $23.00 wide, which is 4.7% of $486.60, so it passes the self-check.
- Target Price: $482.00 (4 days)
- Expected Range: $474.00 to $497.00
- Key Levels: Support at $474.20 (lower Bollinger Band), Resistance at $492.06 (EMA 34)
OVERALL BIAS
OVERALL BIAS: BEARISH - Price is below the falling EMA13/EMA34 after a bearish MACD crossover, with −DI well above +DI and a long-term downtrend below SMA50D and SMA200D. Positive CMF and a weak ADX limit the downside, so the expected move is a modest drift toward the lower Bollinger Band.
This is educational analysis and not financial advice.