SMH 6-day bearish forecast — Nov 15, 2026
- Bias: Bearish
- Timeframe: 6 days (made Nov 15, 2026, target date Nov 20, 2026)
- Price at analysis: $486.60
- Price target: $480.50
- Expected range: $466.00 – $495.00
- Result: Pending — graded after the close on Nov 20, 2026
Get a free AI analysis of SMH today
Analysis
TECHNICAL INDICATORS
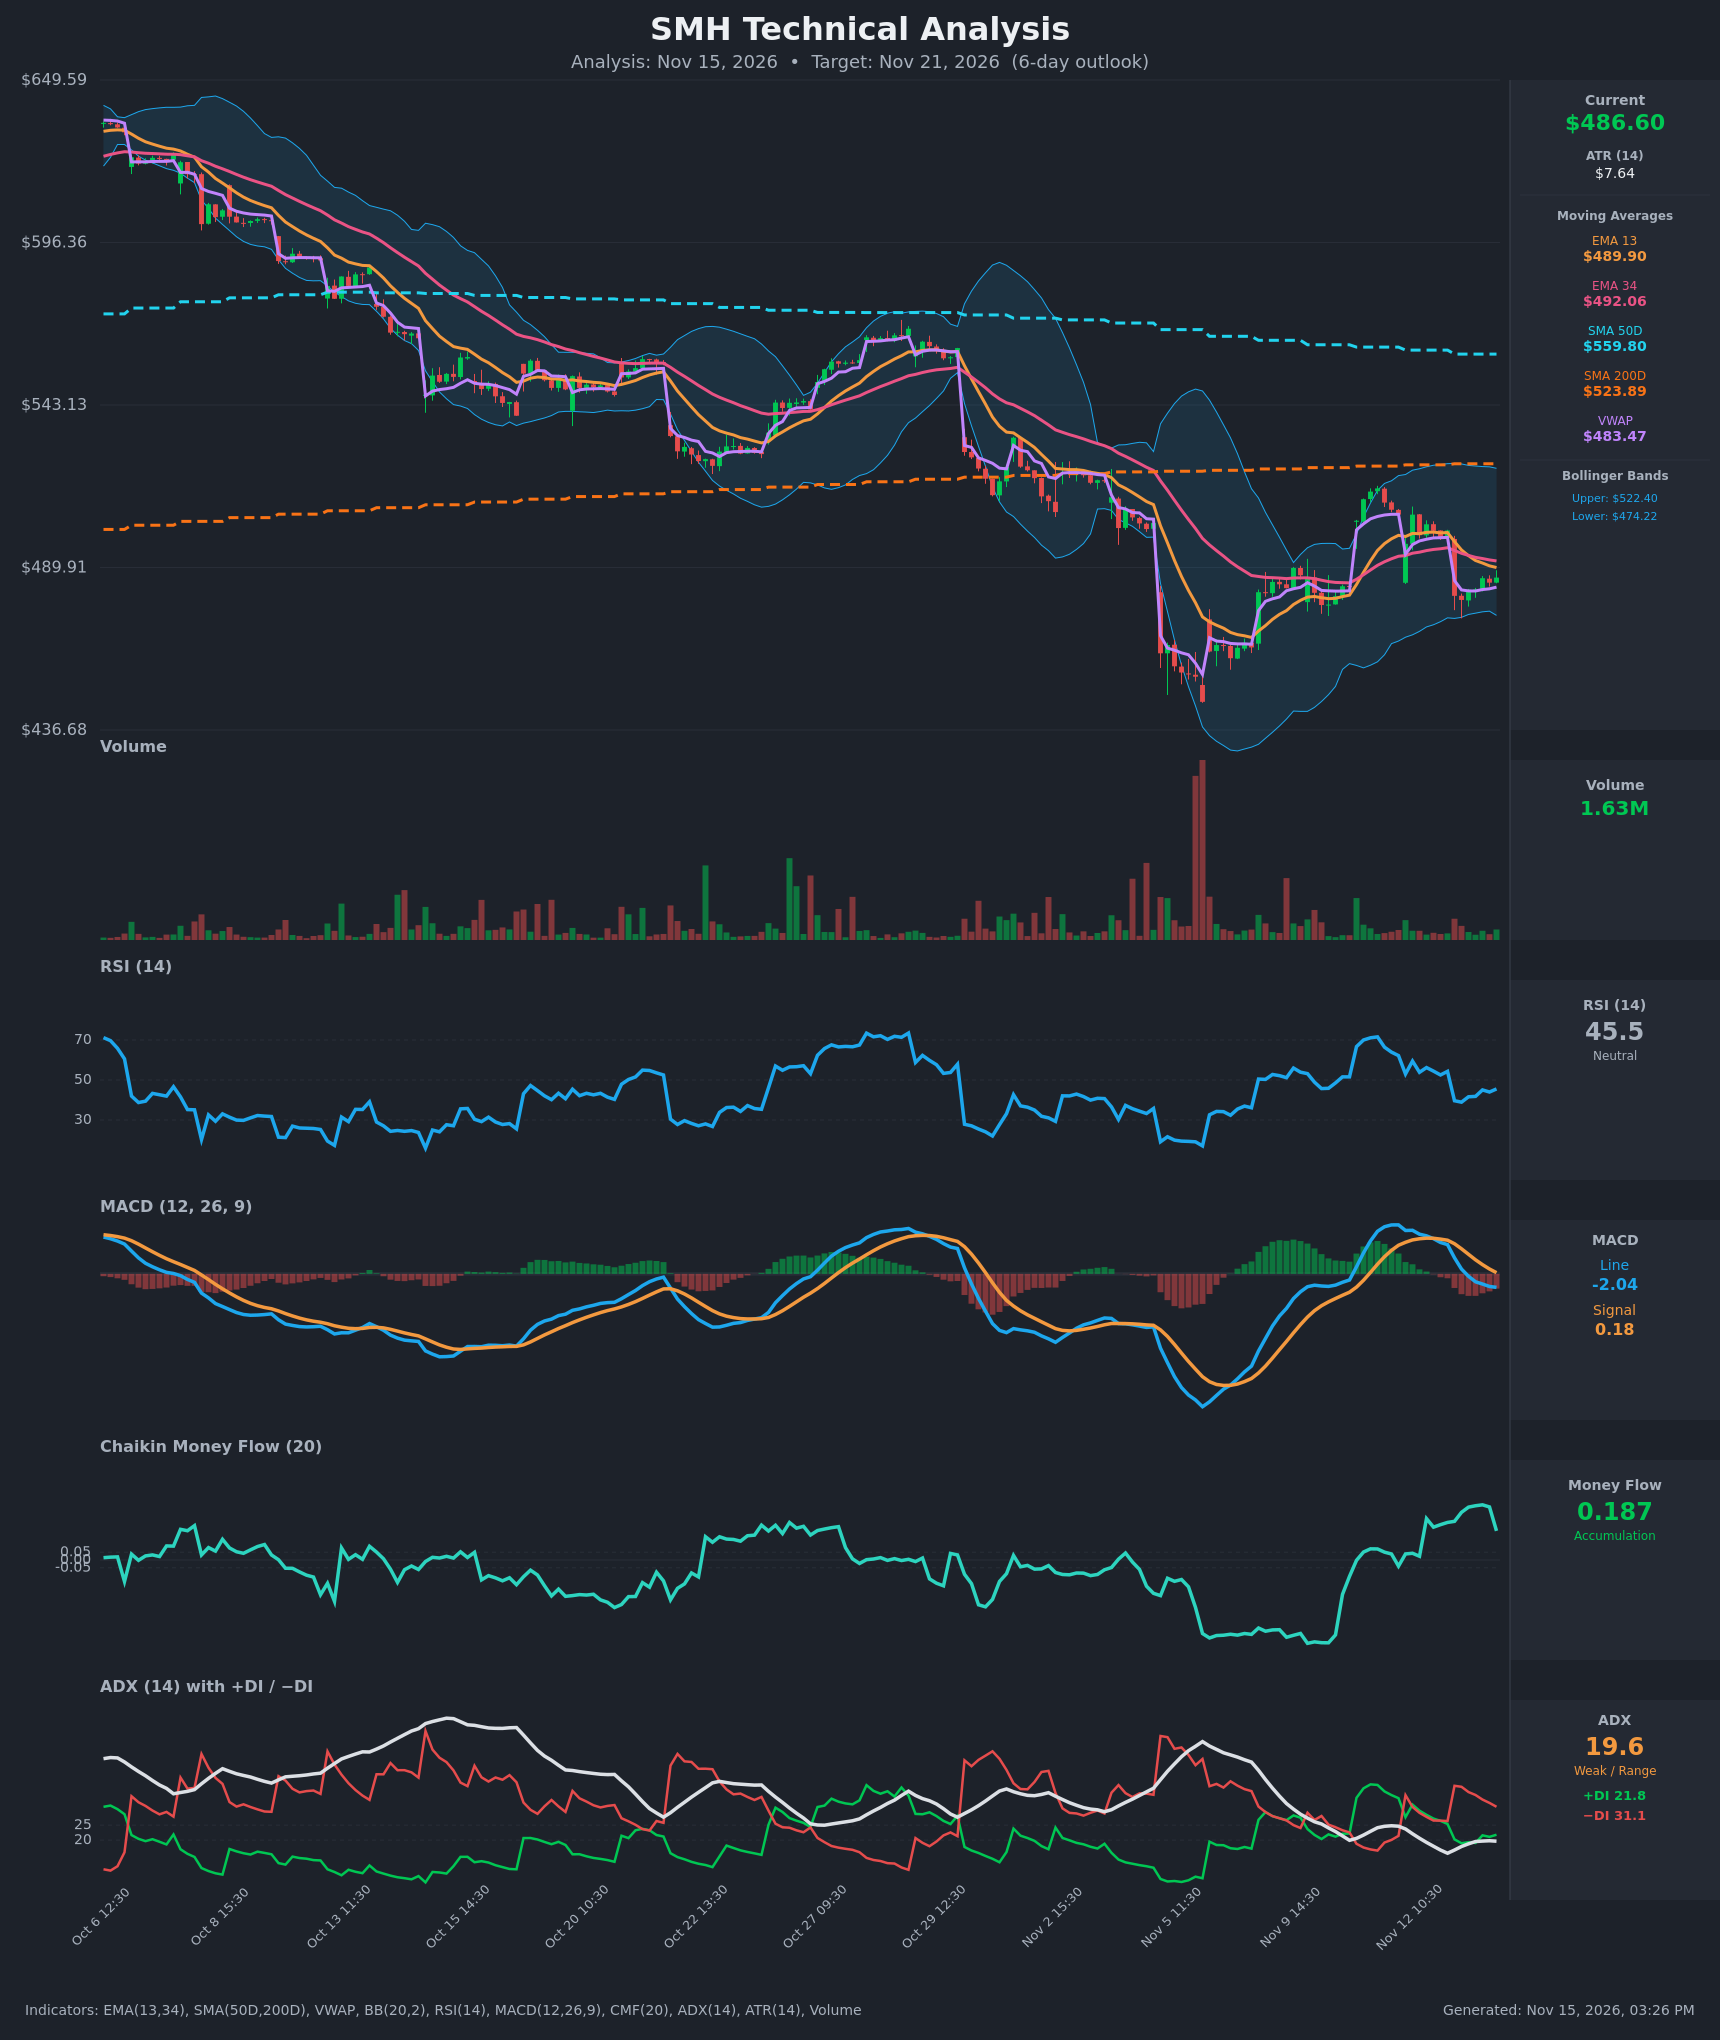
- RSI (14): 45.53, down from ~62 on Nov 11 and a low of 38.9 on Nov 13. It is recovering slightly from that low but stays below 50, so there is no bullish momentum and no oversold reading. [Neutral]
- 20 EMA: The chart shows EMA 13 at $489.90 and EMA 34 at $492.06. Price at $486.60 is below both, and EMA13 crossed below EMA34 on Nov 13. Both averages now act as overhead resistance. [Bearish]
- MACD: Line -2.04 is below signal 0.18, after a bearish crossover around Nov 13 11:30. The histogram is about -2.23 and has narrowed from about -2.94, so downside momentum is fading but not reversed. [Bearish]
- Bollinger Bands (20): Upper $522.40, lower $474.22, so the midline is about $498.30. Price sits in the lower half, roughly 25% of the band width above the lower band. The bands are fairly wide after the early-Nov volatility spike. The midline is overhead resistance, and the lower band is the first support. [Bearish]
- CMF (20): 0.187, well above +0.05. It is off the 0.35 peak but still shows accumulation, meaning closes are near the highs of their ranges despite the drop. This is the main bullish counterpoint. [Accumulation]
- ADX (14): 19.6, below 20, so the trend is weak or range-bound. −DI (31.1) is clearly above +DI (21.8), so sellers hold the edge, though trend strength is low. [Weak Trend, Bearish bias]
- Volume: 1.63M, ordinary and well below the huge capitulation spike around Nov 5. The Nov 13 gap-down came without extreme volume, so selling is orderly rather than panicked. [Neutral]
DIVERGENCES & TRENDS
- Trend: The primary trend is down, from about $640 to the $455 area. Price is below SMA200 ($523.89) and far below SMA50 ($559.80), and both are sloping lower.
- Price vs VWAP: Price at $486.60 is slightly above VWAP ($483.47). This is the one short-term positive and the line that must hold.
- Crossovers: EMA13 crossed below EMA34, and MACD crossed below its signal line. The −DI/+DI gap widened sharply on the Nov 13 gap-down.
- Divergence: CMF is positive and elevated while price made lower highs, a mild bullish divergence. It is not confirmed by price or RSI.
- Momentum: The MACD histogram is contracting, which suggests a slowdown in selling. A bounce toward the EMAs is plausible, but it would likely meet resistance.
CHART PATTERNS
- Rally after the Nov 5 low: Price recovered from about $455 to about $520, then pulled back. This looks like a Bearish Flag/Rising Channel within the larger downtrend. The recent peak at about $520 is below the earlier highs, so lower highs persist.
- Confirmation: A break below $474 (the lower band and the prior support zone) would confirm the pattern. The measured move would point toward $455 or lower.
- Alternative: A Bullish Double Bottom is weakly possible on the $455 to $474 area. It is unconfirmed and would need a close above about $498 to $500.
- Context: The weak ADX argues against a strong breakout in either direction within 6 days.
POTENTIAL SCENARIOS
- Scenario 1: Bearish Rejection at the EMAs and Drift Lower — Price bounces to the $489–$492 EMA cluster, fails, and rolls over with −DI in control and MACD still below signal. Trigger: rejection at $492 or a break below VWAP ($483.47). Target: $474–$480, with a possible test of $470. Invalidation: a daily close above $498 (the Bollinger midline). (50% probability)
- Scenario 2: Bullish Relief Bounce — Positive CMF and a narrowing MACD histogram lead to a squeeze above the EMAs toward the Bollinger midline. Trigger: a clean break above $492 with rising volume. Target: $498–$505. Invalidation: a drop back below $483 or a close under $474. (30% probability)
- Scenario 3: Neutral Chop — Price stays between the lower band and the EMAs because ADX is below 20. Trigger: no break of $474 or $492. Target: $480–$490. Invalidation: a close outside the $474–$492 range. (20% probability)
PRICE TARGETS
For the 6-day horizon:
- Target Price: $480.50
- Expected Range: $466.00 to $495.00 (width $29, about 6.0% of current price, consistent with a 6-day horizon)
- Key Levels: Support at $474.22, Resistance at $492.06
OVERALL BIAS
OVERALL BIAS: BEARISH - Price is below both EMAs and the 200-day SMA, MACD has crossed bearish, and −DI is well above +DI. The bias is modest because ADX is weak and CMF still shows accumulation, so a bounce into the $492–$498 resistance zone is possible before sellers reassert.
This is educational analysis and not financial advice.